Geospatial Data in Soil Sampling: Case Studies
Geospatial data is changing how soil sampling is done, offering more precise, location-based insights for farming. By combining GPS, satellite imagery, and GPS field mapping tools, farmers can better manage soil nutrients, reduce costs, and improve crop yields. Here’s what you need to know:
- What is Geospatial Data? It ties soil information to specific locations using GPS and tools like GIS to create detailed field maps.
- Why It Matters: It addresses inefficiencies in older methods - like uneven fertilizer use and missed soil variations - by enabling precise applications and cost savings.
- Key Benefits: Farmers save money (e.g., $2.25/acre on potash), cut input waste, and boost accuracy (up to 89% for lime application).
- Applications: From high-resolution gamma mapping to GIS in education, geospatial tools are being used to solve real-world problems.
This article explores case studies showing how geospatial data transforms soil sampling, making it more accurate, cost-effective, and actionable for farmers and educators.
Case Study 1: Improving Soil Fertility with Geospatial Analysis
Challenges in Conventional Soil Fertility Management
Traditional soil sampling techniques like composite sampling often fall short. By combining multiple soil cores into one sample, these methods produce averages that obscure critical variations. For instance, a field might report an average pH of 5.4, but this number could be hiding areas that range from dangerously acidic to perfectly balanced. This lack of precision leads to uneven fertilizer application, wasted resources, and reduced crop performance.
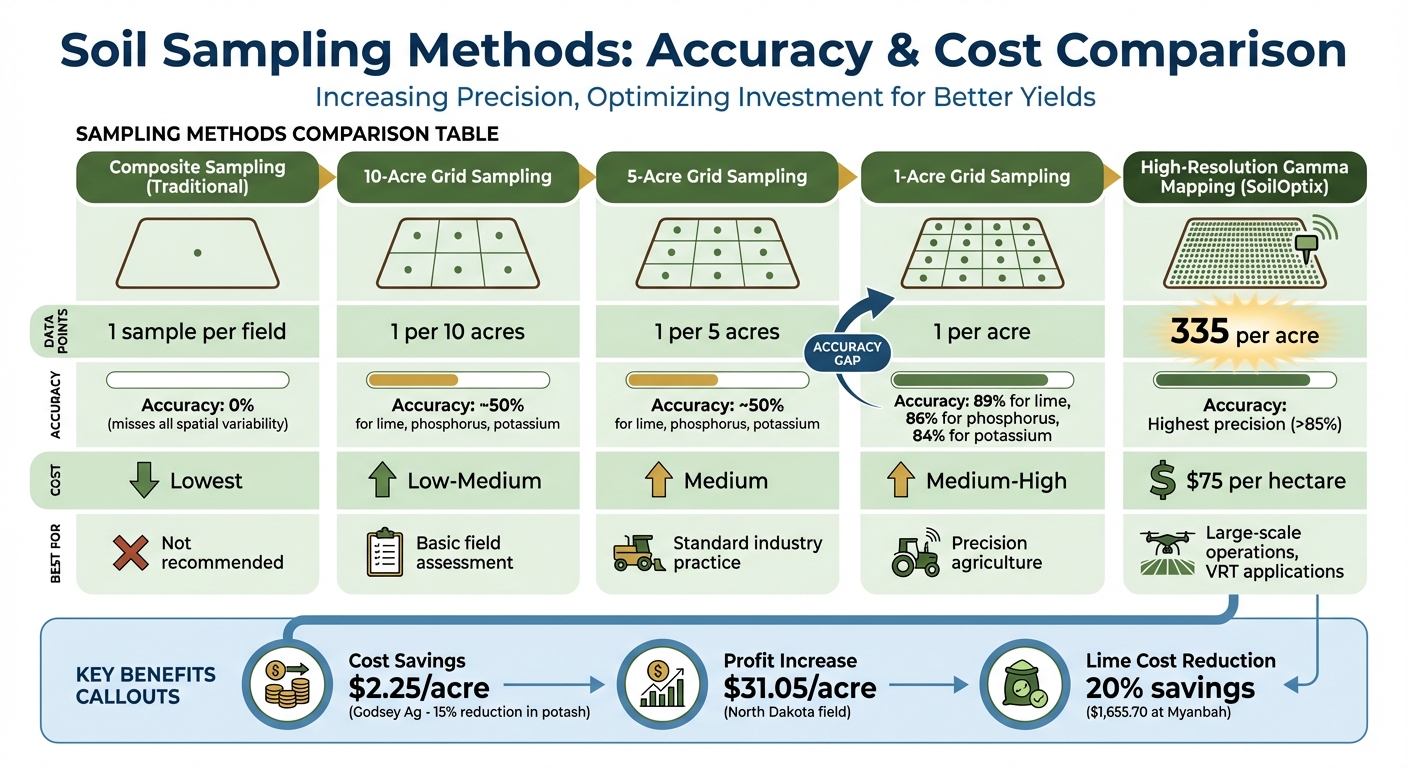
Even grid sampling, a step up from composite sampling, has its limitations. With only one data point collected per 1–5 acres, this method often misses small but crucial nutrient deficiencies or surpluses. When grid sizes expand to 10 acres, application accuracy plummets to about 50%. Adding to the challenge, low-resolution satellite imagery fails to capture these fine-scale variations, leaving farmers to apply fertilizers without a clear understanding of their fields' needs.
These inefficiencies highlight the need for more precise, data-driven approaches.
Geospatial Integration for Fertility Mapping
To close these precision gaps, advanced geospatial tools have stepped in. In April 2024, Chad Godsey of Godsey Ag implemented a cutting-edge solution across farms in Colorado, Nebraska, and Kansas. Using SoilOptix high-resolution gamma radiation mapping, the team achieved an unprecedented level of detail, gathering 335 data points per acre - a dramatic improvement over traditional methods. This technology uses a gamma radiation spectrometer to measure natural soil radiation, creating detailed maps of both physical and chemical properties.
The results were eye-opening. Potassium levels, for example, varied widely within individual fields, ranging from 92 to over 260 ppm. These high-resolution maps were then converted into Variable Rate Technology (VRT) prescriptions - digital instructions for fertilizer application equipment. Spreaders equipped with section control adjusted fertilizer rates in real time as they moved through different zones, replacing the outdated "one-size-fits-all" approach with precise, localized applications .
"In years with low crop margins, high-resolution mapping delivers a strong return on investment with both higher yields from accurate fertilizer placement and either lower soil amendment rates or the optimization of existing budgets for soil amendments." - Steve Redmond, BSc, SoilOptix
Results and Benefits
Switching to high-resolution VRT scripts brought measurable improvements. Godsey Ag reduced its Muriate of Potash application by 15%, cutting the average rate from 58.64 lbs per acre to 50.13 lbs per acre. This adjustment translated into cost savings of $2.25 per acre (based on a potash price of $350 per ton). Additionally, the technology identified under-fertilized areas, allowing nutrients to be reallocated where they were needed most.
The accuracy gains were just as striking. Compared to 10-acre grids, which offer only 50% application accuracy, 1-acre grid sampling achieved 89% accuracy for lime, 86% for phosphorus, and 84% for potassium. This level of precision minimizes waste while ensuring crops receive the exact nutrients they require. By optimizing its fertilizer budget without sacrificing effectiveness, the farm demonstrated how geospatial tools can transform fertility management into a precise, cost-effective process - even during challenging economic times.
Transform Your Agricultural Team
Streamline job management, field mapping, and machine tracking with HarvestYield. Simplify your operations and eliminate paper job sheets.
ContinueCase Study 2: Using GIS in Educational Soil Sampling
Hands-On Learning with GIS Tools
Between August 2022 and October 2024, Clemson University transitioned from paper-based soil sampling to GPS-enabled mobile technology. Professors Elena A. Mikhailova and Christopher J. Post introduced ArcGIS Survey123 into their "Soil Information Systems" course, enabling 113 students from forestry, wildlife biology, and environmental science programs to use their smartphones for field data collection.
This approach proved effective. Students used penetrometers to measure soil penetration resistance across campus. Their phones automatically recorded GPS coordinates and allowed them to attach photos to their observations. By crowdsourcing 222 measurements to a cloud-based repository, the class created a real-time spatial map of soil resistance.
Purdue University adopted a similar approach, combining fieldwork with geospatial technology. Professors Darrell G. Schulze and Phillip R. Owens provided students with ruggedized tablet PCs during field trips. Students tracked their routes using GPS navigation to exact field locations on bus-mounted monitors and personal devices, comparing digital elevation models to physical landforms like eskers - glacial ridges that indicate underlying sand and gravel deposits. This real-time visualization helped students connect geological concepts to tangible features.
"GIS is helping us to teach concepts in our class that would otherwise take students years of field experience to acquire."
– Darrell G. Schulze, Professor of Soil Science, Purdue University
Despite the success of these programs, there were challenges in implementing GIS within educational settings.
Challenges in Implementation
Transitioning to mobile GIS tools came with its share of hurdles. At Clemson, nearly 30% of students were unaware their smartphones had built-in GPS capabilities before the exercise. Technical requirements also created barriers - devices needed to support at least iOS 13 or Android 6.0, leaving some older models incompatible. Additionally, instructors found they needed more physical equipment, such as extra penetrometers, to accommodate larger class sizes.
Smaller institutions faced even greater challenges, including limited software licenses, outdated hardware, unreliable internet access, and insufficient GIS training for educators. To address these gaps, Croatia launched the e-Schools Project (September 2018–September 2022), which offered workshops and professional development to enhance teachers' digital skills and better prepare students for modern technological demands.
Overcoming these barriers ultimately led to measurable improvements in student learning.
Educational Outcomes
Addressing these challenges paid off. Clemson students scored an average of 9 out of 10 on a quiz following their GIS-integrated soil sampling lab. Beyond test scores, students showed remarkable growth in technical literacy: before the exercise, only about 10% felt moderately or extremely familiar with crowdsourcing, but afterward, that number jumped to over 70%. Familiarity with direct and proximal sensing also rose significantly, from less than 10% to nearly 80%.
More importantly, students gained practical skills in analyzing spatial variability in soil properties. They learned to interpret why penetration resistance might vary between areas based on factors like topography or land use.
These programs highlight how GIS tools not only enhance data collection accuracy but also reshape how students perceive and interact with their environment. By blending technology with hands-on learning, educators are equipping students with skills that extend far beyond the classroom.
Making Soil Mapping Technology a Tool in the Precision Ag Toolbox
Case Study 3: Precision Agriculture and Intensive Soil Sampling
Soil Sampling Methods: Accuracy and Cost Comparison
Precision agriculture in the South is breaking away from traditional methods by using advanced, data-driven techniques to tackle field variability on a whole new level.
Using Geospatial Tools for Intensive Sampling
In April 2024, Dr. Chad Godsey of Godsey Ag took on the challenges of the Southern Great Plains by implementing DGPS-guided SoilOptix mapping. This high-resolution tool helped capture detailed potassium variability across fields in Colorado, Nebraska, Kansas, Oklahoma, and Texas. The goal? A more targeted approach to managing soil nutrients.
SoilOptix’s gamma radiation sensors collected an impressive 335 data points per acre, revealing potassium levels ranging from 92 to 260 ppm. This level of detail exposed variability that traditional zone sampling methods had completely missed. Using DGPS, every data point was precisely georeferenced, allowing for the creation of nutrient maps in GIS software. These maps then powered Variable Rate Technology (VRT) prescriptions, enabling modern spreaders equipped with section control to adjust fertilizer application rates in real time. Areas low in nutrients received more fertilizer, while adequately fertilized zones required less.
With such precise nutrient maps, it's worth asking: how do different sampling techniques stack up in terms of accuracy?
Comparing Sampling Techniques
Traditional composite sampling, which involves collecting a single sample per field, completely overlooks spatial variability. Standard grid sampling - typically done at intervals of 2.5 to 5.0 acres - captures broader patterns but lacks the resolution needed for fine-tuned fertilizer placement .
A 2022 study by the University of Georgia compared grid sizes across nine fields in the Southeastern U.S. The findings were eye-opening: grids of 1.0 acre delivered over 80% accuracy for applying lime, phosphorus, and potassium in eight out of the nine fields. In contrast, increasing the grid size to 5.0 acres - a common industry practice - dropped accuracy to just 50%.
Meanwhile, Precision Pastures in Australia took a different route in June 2019 at their 3,146-acre Myanbah operation. Instead of rigid grids, they used FarmLab's zoning tool, which combined gamma-radiometric data, digital elevation models, and satellite NDVI imagery. This approach divided the land into five management zones based on similar soil properties, requiring fewer samples while maintaining precise results across multiple paddocks.
These advancements in sampling techniques are delivering measurable benefits in both costs and yields.
Impact on Fertilizer Application and Yields
At Godsey Ag, moving from traditional zone-based scripts to high-resolution mapping led to a 15% reduction in Muriate of Potash application. With potash priced at $350 per ton, this saved $2.25 per acre while simultaneously boosting yields in areas that had been under-fertilized.
"In years with low crop margins, high resolution provides an unquestionable return on investment with both higher yields from accurate fertilizer placement and either lower soil amendment rates or the optimization of existing budgets for soil amendments."
– Steve Redmond, BSc, SoilOptix
Similarly, at Myanbah in Australia, the geospatial zoning method cut lime application costs by 20%, saving $1,655.70 compared to standard single-rate spreading. The farmer highlighted that this approach eliminated the need for costly transect soil testing while enabling future re-testing of the same zones to monitor soil health improvements.
In North Dakota, a 120-acre field managed with zone-specific nitrogen rates - tailored to yield goals - boosted projected profits by $31.05 per acre, adding up to $3,725 for the entire field. Historical satellite imagery and topographic data helped set realistic yield targets, ranging from 30 bushels per acre on hilltops to 65 bushels per acre in high-yield zones. This prevented over-fertilization in areas that couldn't sustain higher yields, optimizing both inputs and profits.
Key Takeaways from the Case Studies
Here’s a closer look at how geospatial data is redefining soil sampling, based on the case studies.
Common Themes in Geospatial Data Integration
Traditional sampling methods often fail to capture the full variability within fields. For instance, nutrient redistribution caused by livestock or potassium fluctuations in cropping systems often goes unnoticed with whole-field averages or low-resolution grids. A striking example comes from Mt Lonarch in Victoria, Australia, where Scott Howell’s 1-hectare grid sampling revealed sheep camps with Olsen P levels as high as 58 mg/kg. These peaks were completely missed by conventional transect sampling, which cost $7 per hectare. Similarly, Dr. Chad Godsey’s research in the Southern Great Plains uncovered potassium variability ranging from 90 to 270 ppm - variations that standard zone sampling overlooked.
Another recurring theme is the shift toward precision-driven, data-backed approaches. High-resolution mapping, such as gamma radiation sensors providing 335 data points per acre, empowers farm managers to make informed decisions. This technology improves fertilizer placement, reduces waste, and optimizes budgets, offering measurable returns through better yields and more efficient input use.
Benefits of Geospatial Technologies in Soil Sampling
The financial impact of integrating geospatial data is immediate and quantifiable. For example:
- At Godsey Ag, high-resolution mapping cut application inputs, saving $2.25 per acre.
- Myanbah saw a 20% reduction in lime costs, saving $1,655.70 .
- In North Dakota, zone-specific nitrogen management increased projected profits by $31.05 per acre, adding $3,725 to a 120-acre field.
Beyond cost savings, accuracy is another major advantage. Studies show that 1-acre grid sampling achieves over 80% accuracy for lime, phosphorus, and potassium applications. In contrast, expanding grids to 5 acres or more can drop accuracy to about 50%. These efficiencies benefit farms of all sizes, making precision soil sampling a practical choice.
Scalability and Practical Applications
The scalability of geospatial solutions depends on the farm’s size and type. For large cropping operations, high-resolution sensor mapping yields strong returns, especially when paired with variable rate application equipment. In grazing systems, however, the economics shift. While intensive 1-hectare grid sampling at $75 per hectare provides valuable insights, it may not always be cost-effective. Scott Howell’s experience suggests that 2-hectare grid sampling offers a better balance between cost and actionable data for commercial grazing.
Starting small can be a smart move. Scott Howell advises:
"Try precision soil testing a couple of paddocks first, to get a good understanding of the variation and the lay of the land before considering the whole farm".
This gradual approach helps farm managers understand local variability, test their equipment, and refine workflows before scaling up. Additionally, GPS-enabled digital tools help minimize administrative errors and save time. These examples highlight how geospatial technologies can transform soil sampling precision across different types of agricultural operations.
Conclusion
Final Thoughts on Geospatial Data in Soil Sampling
The case studies highlight how geospatial technologies are turning soil sampling into a science-driven process rather than a guessing game. From uncovering hidden nutrient-rich zones that traditional methods often overlook to reducing fertilizer use by 15% and boosting profits by over $31 per acre, the results speak for themselves: precision delivers results. This shift from blanket applications to variable rate technology isn’t just about cutting costs - it’s about maximizing the value of every dollar spent while also promoting better environmental practices by reducing nutrient runoff.
What stands out is the versatility of these technologies across farms of all sizes. Large-scale operations can leverage high-resolution sensor mapping, offering up to 335 data points per acre, while smaller farms might start with zone sampling to understand field variability before expanding further. The real challenge - and opportunity - is in selecting tools and methods that align with each farm’s unique requirements and budget.
How Tools Like HarvestYield Can Help
Effectively using geospatial data goes beyond simply collecting samples - it requires efficient workflows and precise record-keeping. That’s where tools like HarvestYield come in. This GPS-based platform simplifies job tracking by automatically recording location data during fieldwork, minimizing manual errors that could undermine soil sampling accuracy. Its field mapping and measurement features integrate seamlessly with precision agriculture practices, giving contractors and farm managers a single platform to document sample locations, track equipment costs, and manage detailed client records with ease.
FAQs
Which soil sampling method is best for my farm size?
The best soil sampling method for your farm hinges on its size and your specific management goals.
For smaller farms (less than 20 acres), composite sampling is a practical approach. This involves taking 15–20 samples from different spots at a consistent depth. Combining these samples helps you assess overall nutrient levels and pH efficiently.
On larger farms, grid sampling is often the better choice. By breaking fields into smaller sections - such as 1.1-acre grids - you can analyze soil variability in greater detail. This method supports precision farming techniques, like variable-rate fertilization or liming, tailored to each grid's unique needs.
How do I turn soil maps into variable-rate fertilizer applications?
To create variable-rate fertilizer applications, begin by creating detailed soil maps. This involves using grid or zone sampling to capture differences across the field. Once you have this data, analyze it to create prescription maps that outline specific fertilizer rates for each zone. Finally, use equipment that can read these maps and apply fertilizer accordingly. This ensures precise application, matching the needs of each area in the field, promoting better crop growth while minimizing waste.
What data is required to start geospatial soil sampling?
To get started with geospatial soil sampling, you'll need specific data to understand field variability. This includes field boundaries, indicators of soil variability like pH levels and organic matter, and management zones that take into account topography and soil characteristics. You'll also need soil and crop data, such as nutrient levels and moisture content, along with historical and environmental data, including weather trends and past management practices. Together, these elements help create precise zones, pinpoint sampling locations, and map soil variability accurately.