How to Measure Equipment Utilization on Farms
Efficient equipment use is crucial for farm profitability. Measuring utilization helps identify inefficiencies, reduce costs, and improve decision-making. The key metric is the Equipment Utilization Rate (EUR), calculated as:
EUR = (Productive Machine Hours ÷ Scheduled Machine Hours) × 100
Here’s what you need to know:
- Low EUR (common average: ~28%) signals underuse - caused by scheduling issues, downtime, or mismatched machinery.
- High EUR (70%+ target) lowers production costs but requires careful maintenance to avoid wear and tear.
- Other metrics like fuel consumption rates, engine load, and the asset turnover ratio offer deeper insights into efficiency and revenue generation.
Steps to measure and improve utilization:
- Inventory your machinery: Track specs, costs, and usage.
- Collect data: Use telematics for real-time tracking of hours, idling, and performance.
- Calculate EUR: Identify trends by breaking down usage by type, location, and time.
- Analyze metrics: Review engine load, fuel use, and maintenance records.
- Optimize operations: Schedule jobs better, train operators, and perform regular maintenance.
Tools like HarvestYield simplify tracking, reporting, and cost allocation, helping farmers make data-backed decisions. By monitoring utilization consistently, you can cut idle time, prevent breakdowns, and maximize ROI on your machinery.
Key Metrics for Measuring Equipment Utilization
Tracking specific metrics is essential for evaluating how effectively your equipment is being used. These metrics lay the groundwork for the step-by-step process outlined later in this guide.
Productive Machine Hours (PMH) vs. Scheduled Machine Hours (SMH)
Productive Machine Hours (PMH), also known as Run Hours, measure the time your equipment is actively performing tasks - whether it’s planting, harvesting, or tilling. On the other hand, Scheduled Machine Hours (SMH) represent the total time the equipment is available for use, including downtime and idle periods.
To calculate the Equipment Utilization Rate (EUR), divide PMH by SMH and multiply by 100. For instance, if a tractor operates for 35 hours during a 50-hour work week, its utilization rate would be 70%. Many operations average around 28%, which indicates that underutilization is a common issue. For farm equipment, a utilization rate of 70% or more is typically seen as a healthy target. However, reaching 100% utilization is unrealistic due to necessary maintenance, operator breaks, and setup time.
Asset Turnover Ratio
The asset turnover ratio evaluates how effectively your equipment generates revenue compared to its cost. As Mary Anne Mullen from AgDirect explains:
Benchmarking allows producers to identify underlying costs of owning and operating farm equipment and clarifies the true production cost.
To compute this ratio, divide your total farm revenue by the total value of your equipment. A higher ratio means you’re generating more revenue for every dollar invested in equipment. Comparing your ratio to USDA data or operations of a similar size can help you assess your efficiency. This metric underscores the importance of maximizing operational hours to make the most of your investment.
Engine Load and Fuel Consumption Rates
Engine load measures whether your equipment is appropriately sized for the task at hand. Comparing actual engine load to the manufacturer’s specifications can prevent overloading, which can lead to inefficiency and equipment damage.
Fuel consumption rates are another critical factor, as they directly affect operating costs. For example, in 2022, Summit Materials used real-time fuel consumption data and telematics to identify cost-saving opportunities, resulting in substantial annual fuel savings. Similarly, Emil Anderson Construction implemented a policy to shut off engines after 3 minutes of idling, with Equipment Manager James Boydell reporting nearly $400,000 in annual savings.
Modern telematics systems simplify the process by automatically collecting engine load and fuel data. This eliminates manual errors and provides real-time insights into your equipment’s efficiency.
Transform Your Agricultural Team
Streamline job management, field mapping, and machine tracking with HarvestYield. Simplify your operations and eliminate paper job sheets.
ContinueHow to Measure Equipment Utilization: Step-by-Step
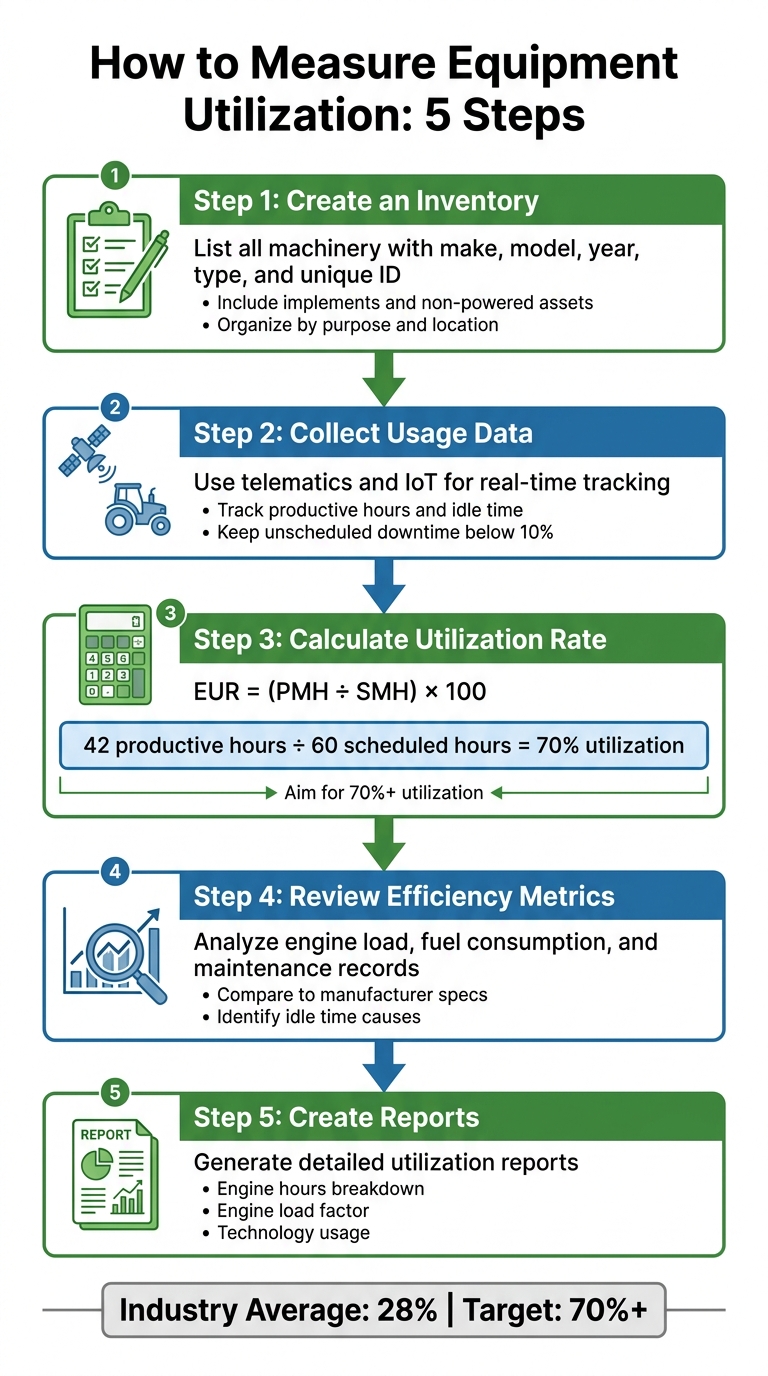
5-Step Process to Measure Farm Equipment Utilization
Measuring equipment utilization accurately can seem complex, but following these five steps can simplify the process and ensure consistency.
Step 1: Create an Inventory of Your Machinery and Equipment
Start by listing all your machinery. Include details such as make, model, year, type, and a unique identifier for each piece of equipment. Don’t forget to include implements and non-powered assets like trailers or tillage equipment.
Organize your inventory by purpose and location using digital tags. This makes it easier to generate utilization reports for specific subsets of your fleet, like all the equipment in a particular field or all harvesting machinery. If you're using equipment from brands like John Deere, you can import your list directly from the John Deere Operations Center, saving time.
| Inventory Data Category | Details to Collect | Why It Matters |
|---|---|---|
| Basic Specs | Make, Model, Year, Type, Nickname | Helps with identification and grouping in reports |
| Acquisition Info | Purchase Date, Total Cost, Lease vs. Own | Useful for calculating fixed costs and depreciation |
| Operational Baseline | Starting Hours, Expected Useful Life | Establishes benchmarks for usage |
| Financial Metrics | Salvage Value, Depreciation Method | Determines hourly ownership costs |
| Categorization | Location, Asset Tags, Primary Use | Aids in comparing efficiency across locations or teams |
Step 2: Collect Usage and Performance Data
Accurate data collection is critical but often a challenge. Thankfully, modern tools like telematics and IoT gateways simplify this process. These tools provide real-time engine diagnostics, GPS tracking, and hour logging.
For example, in 2021, ACV Enviro equipped over 1,000 pieces of equipment with Samsara Asset Gateways. This allowed them to use "Time on Site" reports and geofencing to eliminate manual spreadsheets, reduce rental costs, and improve billing accuracy.
Be sure to track both productive hours (when equipment is actively working) and idle time. Establish policies, like turning off engines after three minutes of idling, to reduce unnecessary wear. Aim to keep unscheduled downtime below 10% of total working time. Real-time data like this feeds directly into utilization calculations.
Step 3: Calculate Utilization Using the PMH/SMH Formula
To determine utilization, divide productive machine hours (PMH) by scheduled machine hours (SMH) and multiply by 100. For instance, if your combine ran for 42 hours during a 60-hour harvest window, the utilization rate would be 70%.
Break down this calculation by equipment type, location, and date to identify trends. You might find that machinery in one area is overworked while similar equipment in another sits idle. As Mary Anne Mullen from AgDirect explains:
Whether you measure profitability by cost per acre or cost per hour, the key is choosing a metric, being consistent, and evaluating your costs regularly.
Step 4: Review Efficiency Metrics and Maintenance Records
Utilization rates are just the start. Dive deeper by reviewing engine load and RPM data to confirm that machines are being used for the right tasks. Compare these figures to manufacturer specifications to avoid overloading or underutilizing equipment.
Cross-check utilization data with maintenance records. For instance, if a tractor shows a high percentage of idle time, investigate the cause. It could be due to operator habits, delays in transport, or scheduling inefficiencies. Craig McGinnis from Komatsu America highlights the risks:
Careless idling drastically devalues equipment because the extra hours spent idling show up in the hours' log, creating the impression that a piece of machinery is more worn out than it is in reality.
These insights can help you identify inefficiencies and make informed decisions.
Step 5: Create Utilization Reports
Finally, compile detailed reports that cover engine hours (working, idle, and transport time), engine load factor (ensuring the right machine is used for each task), and technology usage (linking precision tools with efficiency improvements).
Platforms like John Deere Operations Center or Samsara simplify this process by automating reports, providing remote access to real-time diagnostics, and eliminating manual data entry.
Tools for Tracking Equipment Utilization
A digital platform can revolutionize how you monitor and analyze equipment usage, automating repetitive tasks and providing instant insights into your fleet.
GPS-based tracking simplifies operations by automatically recording equipment activity, eliminating the need for manual timesheets. These platforms collect crucial data like productive machine hours, fuel consumption, and location without extra effort. With cloud syncing, office teams can review reports while field crews log jobs directly from their phones.
It’s also smart to choose tools that combine maintenance tracking with utilization monitoring. By linking service records to operating hours, you can plan maintenance during off-peak times, avoiding disruptions during busy periods. Automated alerts based on cumulative usage help you address potential issues before they turn into costly breakdowns.
Cost allocation is another key feature. The ability to assign expenses like fuel, repairs, and depreciation to specific jobs or fields gives you accurate cost-per-acre data, which is essential for making informed business decisions. Tools that support imperial measurements and U.S. date formats (MM/DD/YYYY) minimize conversion errors, ensuring your data remains consistent. These platforms don’t just track usage - they deliver insights that help you maximize efficiency.
Using HarvestYield for Equipment Tracking
HarvestYield takes these benefits a step further by offering a tailored solution for managing farm equipment.
The platform integrates equipment tracking with job scheduling, GPS logging, and cost analysis. When equipment is assigned to a job, HarvestYield automatically logs machine hours and GPS data as the work progresses. It even records weather conditions for each task, providing valuable context for future planning.
HarvestYield also tracks fuel usage and costs in dollars, helping you calculate efficiency metrics like gallons per acre or cost per hour. With field mapping tools, you can measure exact acreage and link it to equipment usage. Operators can upload fuel receipts via their phones, and all this data flows seamlessly into detailed utilization reports.
The platform goes further by connecting operating hours to depreciation calculations, giving you real-time insights into equipment costs. For contractors, client management features allow you to attribute machine hours and expenses to specific jobs, making billing more accurate. Plus, with offline mobile logging that syncs once connectivity is restored, you can maintain nearly uninterrupted tracking - even in remote areas with unreliable cell service, a common issue on U.S. farms.
How to Interpret Results and Benchmarks
After calculating and reporting your utilization rates, the next step is to compare these numbers against industry standards. This will help you identify areas where improvements can make the most impact.
Industry Benchmarks for Utilization Metrics
Stacking your data against industry benchmarks provides a clearer picture of your performance. For example, in 2022, the average machinery cost per acre for corn and soybean farms was $148, while the average crop machinery investment per acre stood at $695. Interestingly, high-profit farms (those in the top 20%) reported $156 per acre in machinery costs for corn - 14.4% lower than the overall average - with investments averaging $650 per acre. On the other hand, low-profit farms (bottom 20%) incurred $209 per acre in machinery costs and carried machinery investments of $863 per acre. These numbers underscore just how much machinery costs influence a farm's financial health.
That said, spending less doesn’t always equate to efficiency. Jerry Auel, Vice President at AgDirect, cautions:
Just because someone has a low machinery investment doesn't necessarily lead to profitability because they may be using old equipment that is not efficient and could impact timely planting and harvest.
Farmers with owned land and lower land costs might manage machinery expenses above $100 per acre. In contrast, renters dealing with high cash rents often need to keep machinery costs much tighter.
Beyond financial benchmarks, you can also assess operational efficiency by analyzing working, transport, and idle hours. Modern telematics systems break engine hours into these categories, making it easier to spot inefficiencies. For instance, if idle hours exceed your goals, it’s worth investigating specific machines or operators to cut down on waste. Similarly, comparing engine load factors with OEM specifications can help you evaluate whether your equipment is appropriately sized. A large tractor with a consistently low load factor might indicate wasted power on tasks that don’t require such capacity.
With these benchmarks, you can start identifying inefficiencies and areas for improvement.
Using Metrics to Find Areas for Improvement
Once you’ve established industry benchmarks, it’s time to dig deeper into your fleet’s data. Look for machines with idle or transport hours that stand out compared to the rest of your equipment. Maria Goretty, Southwest Region Agronomist at RDO Equipment Co., suggests:
If the percentage of idle hours exceeds your goal idle, look at other tractors in the fleet. Is it an outlier?
Next, calculate the real cost of inefficiencies. High transport hours, when combined with expenses like fuel, labor, and warranty costs, might indicate that outsourcing certain tasks is more cost-effective than owning the equipment. Similarly, machines with consistently low engine load factors may be oversized for their tasks. Switching to smaller equipment could save fuel and reduce wear on high-value assets.
You can also compare your operation’s liquidity, solvency, and asset turnover ratios with data from peer groups, such as land grant universities or USDA resources. This helps you understand how your operation stacks up against others of similar size and scope. By doing so, you can uncover hidden costs in your production process and identify where your operation deviates from profitable benchmarks.
Finally, set a budget at the start of each year to establish clear targets, such as cost per acre or cost per hour. Monitor your progress monthly or quarterly so you can make timely adjustments to stay on track.
How to Improve Equipment Utilization
Once you've pinpointed inefficiencies, it's time to take action. Boosting equipment utilization not only reduces downtime but also trims operating costs, a key goal for effective farm management. Below are some strategies to help you get more productive hours out of your machinery, save money, and extend its lifespan.
Schedule Regular Maintenance and Inspections
Preventive maintenance is your best defense against expensive breakdowns. Emergency repairs can cost two to three times more than scheduled maintenance, and unexpected downtime could set a farm back anywhere from $500 to over $5,000 per day in lost productivity. On top of that, neglecting maintenance can shorten equipment lifespan by 20% to 40%.
To stay ahead, schedule maintenance based on either operating hours (e.g., every 250 hours) or fixed intervals (like every six months), whichever comes first. Operators should also perform a quick daily walk-around before starting work. This five-minute check includes looking for leaks, checking fluid levels, inspecting tire pressure, and spotting visible damage. As SmartFarmPilot wisely notes:
"Catching a small leak today prevents a $5,000 repair next week."
Seasonal preparation is equally important. Before the busy season kicks off, run every piece of equipment through a detailed readiness check. During off-seasons, follow proper storage practices, such as filling fuel tanks to prevent condensation and using battery maintainers. These steps can help you avoid start-up issues when your equipment is needed most.
Once your maintenance routine is solid, focus on scheduling to keep machines productive.
Optimize Job Scheduling
Poor scheduling doesn’t just affect one machine - it impacts your entire operation. Missed harvest windows, idle crews, and wasted productivity are common ripple effects of disorganized planning. Real-time tracking and GPS data can help you monitor equipment location and status (Active, Inactive, or In Maintenance), making it easier to reassign resources and cut down on idle transport time.
Tools like HarvestYield’s job scheduling features can further reduce downtime by connecting equipment usage logs directly to specific tasks. This gives you a clear picture of how long different activities take, enabling better planning. GPS tracking also highlights inefficiencies, such as excessive transport hours, so you can address bottlenecks quickly.
Train Operators for Better Equipment Handling
Proper operator training is another way to improve equipment utilization. When operators know how to handle machinery correctly, they reduce unnecessary wear and tear. This includes matching the engine load to the task - using a heavy-duty tractor for light work not only wastes fuel but also racks up unneeded operating hours on high-value equipment.
Standardized procedures across your team ensure consistent equipment use, which leads to fewer breakdowns and smoother performance. Well-maintained machinery with detailed service records can also fetch a resale value that’s 30% to 50% higher than neglected units. In this sense, investing in operator training pays off long after the equipment has left your farm.
Conclusion
Measuring equipment utilization transforms farm management from guesswork to a more strategic, data-driven approach. Understanding how your machinery is performing allows you to improve productivity, cut down on unnecessary costs like idle time and wasted fuel, and make smarter decisions about your assets. As Mary Anne Mullen, Vice President of Credit at AgDirect, explains:
If you're analyzing your equipment line-up once a year, it can seem like a hassle. But if it is a regular part of your financial management, it feels more like operating a gearshift – second nature.
A good starting point is a baseline assessment. Set an annual budget and choose a consistent metric - such as cost per acre or cost per hour - to track regularly. This data can reveal inefficiencies, like excessive idle time or underutilized equipment, and help you make decisions like resizing your fleet, reallocating resources, or avoiding unnecessary purchases. It also ensures you're making the most of warranties and other cost-saving measures.
Tools like HarvestYield simplify this process by linking usage logs to specific tasks with GPS data, eliminating the need for manual job sheets by going paperless. With real-time insights, you can monitor machine locations, usage patterns, and areas requiring attention. This makes it easier to compare idle versus active time, evaluate efficiency, and make informed decisions about maintenance and scheduling.
FAQs
What counts as productive hours vs. idle hours?
Productive hours refer to the time when farm equipment is actively engaged in tasks like planting, harvesting, or other essential operations. These are the hours when machinery is directly contributing to the work on the farm.
On the other hand, idle hours occur when equipment is not in active use. This could include periods of waiting, maintenance, or downtime caused by breakdowns. Essentially, productive hours focus on direct action, while idle hours highlight moments when the equipment isn't adding to the farm's output.
How do I set scheduled machine hours on my farm?
Using farm management software is a smart way to plan and allocate machine hours effectively. Tools like HarvestYield make it simple to schedule and track usage for each piece of equipment.
Here’s how it works: Input the desired machine hours into the platform, save your schedule, and then monitor actual usage compared to your plan. This process not only helps you keep track of performance but also ensures you avoid overusing equipment and manage utilization more effectively.
What utilization rate is “good” for my equipment?
A strong equipment utilization rate generally falls between 70% and 80%. This range suggests that machinery is being used effectively without pushing it too hard. Maintaining this balance supports both productivity and the long-term health of the equipment.