Prescription Maps: Key to Smarter Resource Allocation
If I had to boil it down to one point, it’s this: prescription maps help me stop treating every acre the same. When fields vary, zone-based rates can cut fertilizer use by 10% to 25%, crop protection use by 15% to 30%, and irrigation water by 8% to 26% in the right fields. In many cases, yield stays close to flat, which is why returns can improve.
Here’s the short version:
- What they do: turn field data into GPS-based rate plans
- How they’re built: using yield maps, soil tests, EC, elevation, and crop imagery
- How many zones work best: usually 3 to 4
- Where they fit best: fields with clear soil, drainage, and yield differences
- What they can save: inputs, water, pumping cost, and some runoff
- What they need: clean data, calibrated equipment, file compatibility, and solid records
- What to watch: returns vary a lot by field, season, and input prices
A static map usually fits fertilizer, lime, and seeding. A dynamic map makes more sense for irrigation, where in-season stress and soil moisture can shift. That’s the core idea: use rates that match the part of the field, not one flat rate for all of it.
| Area | Main takeaway |
|---|---|
| Fertility | Lower use often comes from cutting rates in low-response zones |
| Irrigation | Water savings are strongest where soils vary across the field |
| Profit | Gains may be modest, but they can add up when input use drops |
| Setup | Data cleanup and controller-ready files matter as much as the map |
| Long-term use | Good records help me improve the next prescription, not just repeat the last one |
So when I look at prescription maps in plain terms, I see a simple trade: more planning upfront for tighter input use across the season.
Variable Rate Applications: From Zones to Prescriptions
Transform Your Agricultural Team
Streamline job management, field mapping, and machine tracking with HarvestYield. Simplify your operations and eliminate paper job sheets.
ContinueHow Prescription Maps Are Built From Field Data
Building a prescription map is basically a process of layering field data until the patterns are clear enough to assign rates by zone. The aim is simple: put more input where the crop is likely to respond, and hold back where returns are lower. From there, the job becomes turning that field variability into a small set of usable zones.
Data Layers Used to Identify Management Zones
Most workflows start with multi-year yield maps from combine monitors. You want at least three cleaned, calibrated years so you don't overreact to one odd season. Soil sampling adds pH, nutrient levels, and organic matter. Soil electrical conductivity, or EC, measured with tools like Veris, helps point to texture, water-holding capacity, salinity, and depth to restrictive layers.
Elevation and topography add another piece of the puzzle. They help show drainage patterns, erosion risk, and spots where moisture tends to collect. In plain terms, they flag areas more likely to deal with standing water, drought stress, or soil loss. Satellite imagery, especially NDVI time series, then shows where crop vigor tends to lag or lead across the field during the season. After that, clustering software sorts those layers into management zones, using each one to help show where inputs are more likely to pay.
| Data Layer | What It Reveals |
|---|---|
| Multi-year yield maps | Stable high/low productivity patterns |
| Soil EC | Texture, water-holding capacity, salinity |
| Elevation/topography | Drainage, erosion risk, moisture accumulation |
| Soil sampling | pH, nutrients, organic matter |
| Satellite/drone NDVI | In-season crop vigor and stress patterns |
In most cases, all of that gets narrowed down to three or four zones.
Why Most Studies Use Three to Four Zones
There's a reason three or four zones show up so often in the research. Studies using clustering metrics such as Fuzziness Performance Index (FPI) and Normalized Classification Entropy (NCE) show that 3–4 zones tend to cut error while still being easy to interpret. One sustainability-focused study found that optimal zoning came from 3–4 classes. A classic delineation study also found no gain from splitting fields into more than four or five management zones.
So the practical rule is straightforward: start with three zones unless your data make a strong case for more.
That same zone setup is what static prescriptions rely on, while irrigation systems can revise it during the season.
Static vs. Dynamic Prescription Maps
Most prescription maps are static. They're built before planting from yield, soil, elevation, and test data. That makes them a good fit for fertilizer, lime, and seeding because the main field patterns usually don't change much year to year.
Dynamic maps are different. They update during the season using real-time inputs, and they matter most when conditions shift fast enough to change water-use efficiency. In irrigation research, one method combines a crop-energy-water balance model with satellite vegetation indices and land surface temperature to estimate soil moisture deficits pixel by pixel, then creates updated irrigation prescriptions at several points during the season. Another method puts infrared thermometers on moving sprinkler systems to measure canopy temperature each day, then turns plant stress readings into variable-rate irrigation maps. A third uses soil moisture sensors and soil-water models to estimate daily zone demand and send prescriptions straight to the irrigation controller.
Static maps are still the standard for fertility and seeding. Dynamic maps are gaining ground in center-pivot irrigation, where real-time water savings can justify the extra data.
What Research Shows About Input Savings, Yield, and Waste Reduction
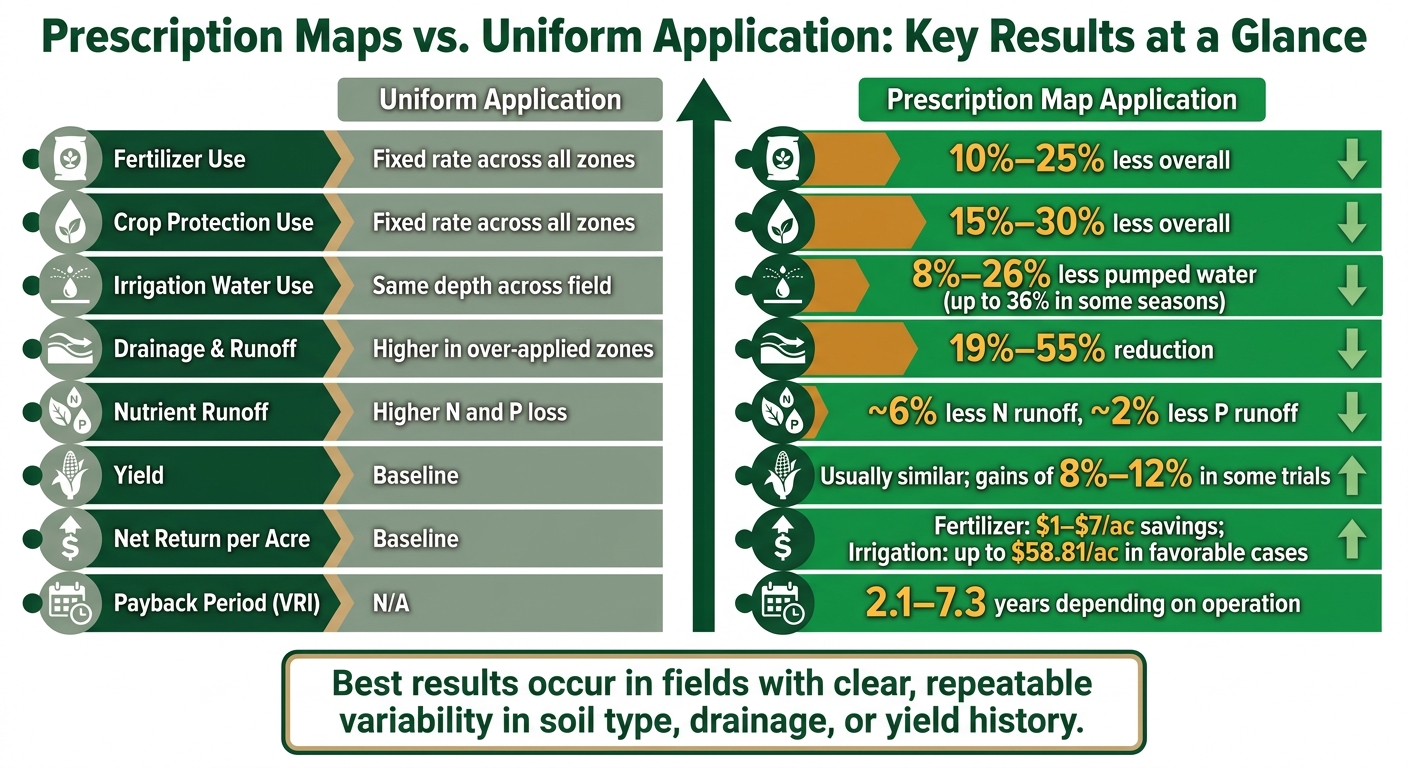
Prescription Maps vs. Uniform Application: Input Savings & Returns
Fertilizer and Crop Protection Use Often Drops Without Yield Loss
After zones are mapped, the big question is simple: do they cut input use without hurting yield? In many cases, yes.
Prescription-based variable rate programs often reduce inputs while keeping yields about the same. A systematic review of precision agriculture case studies found 15% to 25% lower fertilizer use and 20% to 30% lower crop protection use under variable rate technology. Across several trials, yields also improved by 8% to 12%.
Nitrogen gets the most attention, and for good reason. In winter wheat, sensor-guided variable-rate nitrogen reduced N use while yields remained statistically similar to uniform application. In corn, site-specific N programs in high-variability fields increased net returns by about $7 to $12 per acre.
Per-acre fertilizer savings from variable rate N and NPK programs usually land in the $1.00 to $7.00 per acre range. Most of that comes from applying less in low-response zones, where extra fertilizer doesn't pay off. Crop protection savings tend to be smaller, but prescription spraying can still trim spray volume by a few percent without hurting control.
Water Use Improves With Zone-Based Irrigation
The biggest water savings show up when soils change enough across the field to make zone-based control worth it. If one part of a field holds water well and another dries out fast, using the same irrigation depth everywhere is a bit like filling every cup to the brim, even when some are already full.
A USDA ARS field study on corn and soybean in a humid climate found that variable rate irrigation (VRI) used 25% less water than uniform rate irrigation. At the same time, soybean yields increased by 2.8% and corn yields by 0.8%. Irrigation water productivity improved by 24.8% for soybean and 27.1% for corn.
Across a wider set of studies, VRI water savings ranged from 8% to 26%, with some case studies reaching 36% in certain seasons or soil zones. Over-irrigation and drainage also fell a lot. Several analyses reported 19% to 55% reductions in drainage and runoff because prescriptions avoided applying water where soils were already close to capacity.
There’s also an energy angle. Less pumping means lower power use, and some precision irrigation scenarios reported cuts of 23 to 67 kg CO₂-equivalent per hectare per year.
That said, this isn’t a win in every field. In areas with fairly uniform soils, some studies found no measurable water savings from VRI. In a few cases, the only savings came from skipping non-cropped areas such as pivot corners.
Economic and Field-Scale Results
When yields stay flat, even modest input cuts can improve returns. That’s the part that matters on the balance sheet. In fields with enough variability, lower input use often covers the added cost of the technology. In more uniform fields, or when input prices are low, the math gets tighter.
For variable rate irrigation, one Nebraska feasibility analysis estimated annual net profit at $23 per acre and $58.81 per acre for two separate operations. The payback periods for the farmer’s share of the technology cost were 7.3 years and 2.1 years. For fertilizer VRT, estimated profit ranged from about -$166 to +$142 per acre after converting from the reported hectare values.
| Factor | Uniform Application | Prescription Map Application |
|---|---|---|
| Fertilizer/crop protection use | Fixed rate across all zones | Reduced in low-response zones; often 10% to 30% less overall |
| Irrigation water use | Same depth across field | 8% to 26% less pumped water in variable-soil fields |
| Yield | Baseline | Usually similar; gains depend on the field |
| Net return per acre | Baseline | Often a few dollars higher for fertilizer; up to $58.81/ac for irrigation in favorable cases |
| Nutrient runoff | Higher in over-applied zones | About 6% less N runoff and 2% less P runoff |
Even when yield gains are small, lower input costs often make prescription maps pencil out better than uniform application.
What It Takes to Use Prescription Maps on a U.S. Farm
Prescription maps don't do much on their own. They only work when the data, the machine, and the records all match up in the field.
Equipment, Software, and Data Requirements
Variable-rate application starts with GPS/GNSS guidance. In most cases, that means sub-meter correction, so the machine can stay on the prescription without skips, overlaps, or drifting past field boundaries.
The rest of the setup matters just as much. Farms need yield monitors, soil tests, GIS or farm management software, and controllers that can read the prescription file. File compatibility is a big deal. If the map can't export in a format the controller can read and run, the whole plan stalls.
Where Adoption Pays Off and Where It Falls Short
Even with the right setup, a prescription map only makes sense when field variability is big enough to support zone-based management. It tends to work best in fields with uneven soil texture, topsoil depth, pH, drainage, water-holding capacity, or yield history.
Studies tie better profit and water-quality outcomes to fields with more topsoil and pH variation. Reported net returns ranged from $4.96 to $31.77 per acre in separate studies.
Cost was the top barrier for 69% of commercial producers. And the issue isn't just buying hardware and software. Farms also have to clean up data, deal with compatibility problems, and show field-by-field ROI.
Adoption is still mixed across the U.S. Only about 27% of U.S. farms used some form of precision agriculture in 2023. At the same time, variable-rate technology covered 37% of corn acres and 25% of soybean acres.
How Digital Job Records Support Better Map Execution
Once the system is up and running, recordkeeping decides whether the next prescription gets better or just repeats the same mistakes. Digital job records close that loop. They track field boundaries, prescription files, application dates, actual rates, the operator, the machine, and weather.
HarvestYield supports that workflow by keeping GPS- and weather-linked job records, field maps, and machine costs in one place.
Conclusion: Why Prescription Maps Lead to Smarter Resource Allocation
Once a prescription map is loaded and put to work, the next thing that matters is simple: does it pay off in the field? Prescription maps turn field variability into zone-based input rates, so you’re not treating every acre the same when the field clearly isn’t the same. Research often shows fertilizer savings of 10%–25% and crop protection savings of 15%–30%, often without measurable yield loss.
The payoff is usually strongest in fields with clear, repeatable variability in soil type, drainage, or yield history. That’s where variable-rate application has the best shot at making a difference. Economic studies from Midwestern fields found results ranging from -$10 to $40 per acre for most operations, with some fields reaching as high as $200 per acre in gains. In more uniform fields, returns tend to be smaller, and the extra work may not pencil out.
In practice, the biggest gains usually don’t show up in just one season. They build over time. ROI often levels out over 2–3 seasons as zone boundaries get tuned up and input rates improve with more field data.
What happens after application matters just as much as the map itself. Records are what show whether the next prescription should stay the same or change. That’s why calibrated equipment and consistent records matter so much: compatible prescription files, plus detailed records of what was applied, where, and when. Digital job records keep GPS, application, and machine-cost data in one place - like those supported by HarvestYield - which makes season-over-season comparison and fine-tuning much easier.
The best results come from solid data, calibrated equipment, and consistent recordkeeping.
FAQs
How do I know if my fields need prescription maps?
Consider prescription maps if you want to move from uniform application to variable-rate strategies.
They make the most sense when yield data, soil types, or crop zones vary across your fields. That way, you can apply more seed, fertilizer, or chemicals in high-yield areas and use less in lower-performing zones, which can cut costs and reduce waste.
What data should I collect before creating a map?
Before creating a prescription map, gather exact field boundary data. That includes the field name or number, total acreage, and GPS coordinates for both the centroid and the field boundaries.
You should also collect the date mapped, plus key field details such as:
- Soil type
- Drainage
- Crop and yield history
- Access details
- Problem areas
- Hazards or obstacles
Miss one of these details, and the map can end up pointing you in the wrong direction.
How long does it take to see ROI from prescription maps?
For mid- to large-size farming operations, ROI from prescription maps and related GPS tracking systems often shows up within one to three seasons.
The payoff usually comes from lower fuel, labor, and input costs, along with less waste and fewer day-to-day inefficiencies. Setup does take some time. But in many cases, these digital systems pay for themselves fairly fast through better billing accuracy, labor hours saved, and tighter input spending.