How Real-Time Field Data Improves Farm Decisions
Real-time field data is transforming farm management by providing instant updates on soil, crops, and equipment performance. Instead of relying on outdated methods like manual notes or occasional inspections, farmers now use sensors, GPS tools, and digital platforms to make faster, more accurate decisions. Here’s how it works:
- Live Monitoring: Track soil moisture, sprayer coverage, and equipment performance as it happens.
- Improved Efficiency: Farms like Columbia Farm Services boosted work efficiency by 26%, while others reduced labor costs by $40 per acre annually.
- Digital Tools: Platforms like HarvestYield automate data collection, even offline, and centralize information for easy access.
- Precision Management: Use tools like NDVI maps and soil sensors to optimize irrigation, fertilization, and harvest timing.
This shift eliminates guesswork, reduces waste, and increases productivity, giving farmers a clearer view of their operations and better control over resources.
Farming Smarter with Real-Time Data | Windimere Farms Story
Setting Up a Real-Time Field Data System
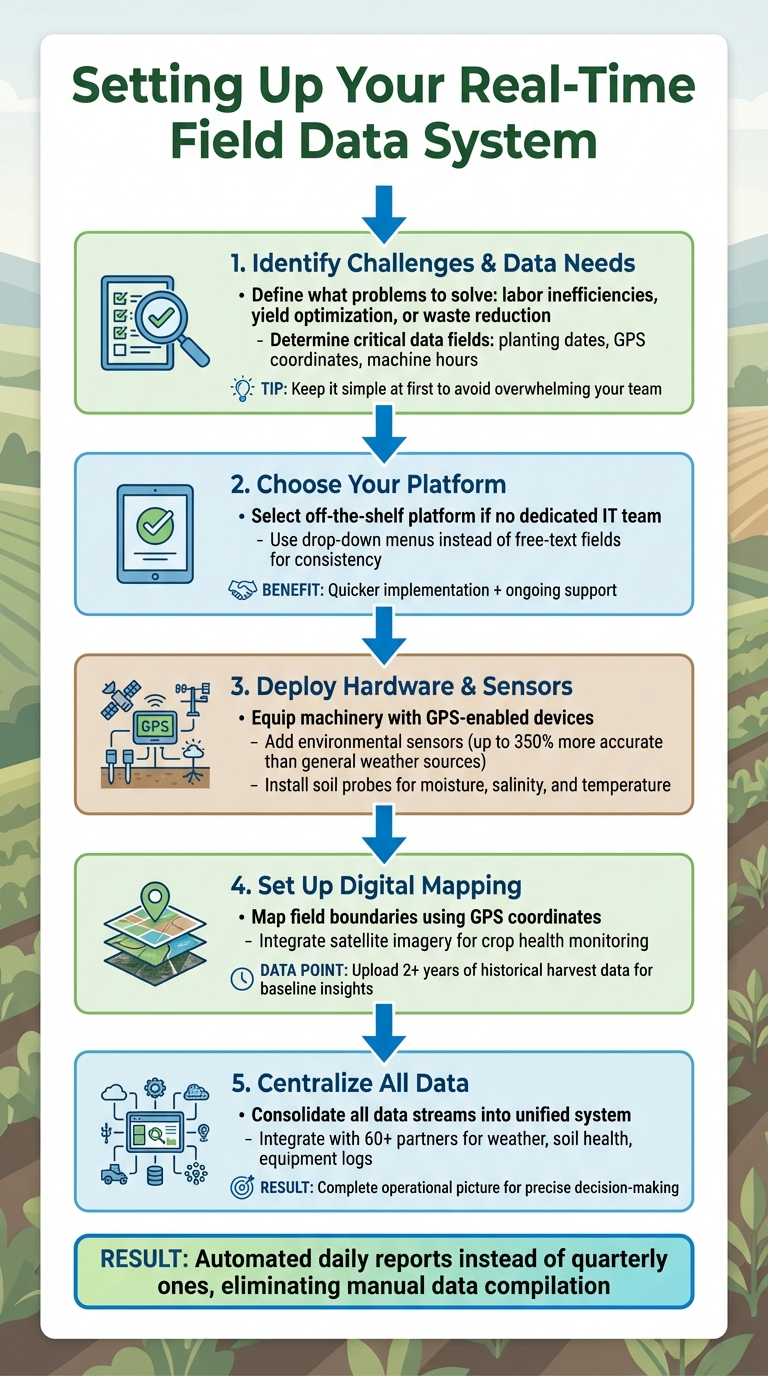
5-Step Guide to Setting Up Real-Time Farm Data System
Start by identifying the main challenges you want to address - whether it's labor inefficiencies, yield optimization, or waste reduction - and determine how each piece of data will guide your decisions. If your farm doesn’t have a dedicated IT team, choosing an off-the-shelf platform is often the smarter move. These systems are quicker to implement and come with ongoing support, saving you from technical headaches.
Define the critical data fields you’ll need, such as planting and harvest dates, GPS coordinates, and machine hours. Keep it simple at first to avoid overwhelming your team. For consistency, use drop-down menus instead of free-text fields when designing data entry forms - this reduces errors and keeps your records clean. Once you’ve got a clear plan and know what data you need, deploy the necessary hardware to start collecting it.
Equip your machinery with GPS-enabled devices to automate data collection. Add environmental and soil sensors to gain a deeper understanding of field conditions. For example, Scott Friestad, a farmer in Morris, IL, uses Climate FieldView to track every operation - planting, spraying, and harvesting - creating real-time field maps that analyze yields across his corn and soybean fields. Environmental sensors provide hyper-local weather data, which can be up to 350% more accurate than general weather sources, especially in frost-prone areas. Soil probes measuring moisture, salinity, and temperature round out the picture, feeding data directly into digital maps for field analysis.
Digital mapping ties everything together. Tools like HarvestYield allow you to precisely map field boundaries and integrate satellite imagery to monitor crop health using vegetation indices. Uploading at least two years of historical harvest and treatment data gives these tools a baseline for immediate insights. This historical data helps you identify trends and anomalies in real-time rather than weeks later. Once the mapping is complete, consolidate everything into a single dashboard for actionable insights.
Finally, centralize all data streams into one unified system. Modern platforms can integrate with over 60 partners, pulling together weather data, soil health metrics, and equipment logs into one view. Jake Peissig of JTP Farms in Wisconsin adopted this approach in July 2024, automating daily reports instead of relying on quarterly ones. As he explained:
"The Connecterra app has been a fast and convenient way to analyze herd data on the farm by taking away all the work of compiling and organizing the data. Now things can be set up and easily organized into reports that are of value to me and my dairy".
By combining these diverse data points, you create a complete operational picture, enabling precise and timely decision-making.
Deploying Sensors and GPS Tracking
The right sensors and GPS tools turn raw field activity into actionable insights. In-cab GPS hardware, like the FieldView Drive 2.0, connects to farm equipment via Bluetooth, streaming real-time data on metrics like seed population, yield, and moisture as you move through the field. These devices pull data from the machine's CAN bus and sync it to tablets or smartphones, enabling operators to watch maps build in real-time. This allows for immediate problem-solving, whether it’s excessive downforce during planting or a clogged nozzle during spraying.
Environmental sensors track weather variables that influence critical decisions. Devices that measure temperature, rainfall, humidity, solar radiation, wind speed, and vapor pressure deficit are easy to maintain and provide a wealth of data. These sensors generate millions of data points quarterly, refining your understanding of field conditions. Place them strategically to capture local variations in crop performance.
Plant health and soil sensors add another layer of monitoring. Tools that measure the Normalized Difference Vegetation Index (NDVI), chlorophyll levels, and canopy temperature can detect crop stress and growth stages before they’re visible to the eye. Soil probes tracking moisture, salinity, and temperature help fine-tune irrigation schedules and prevent overwatering. D'Arcy Hilgartner, a farmer in Alberta, uses FieldView during harvest to collect real-time data across his team, improving logistics and performance management.
Digital scouting tools with GPS pins make it easy to mark specific problem areas - like weed infestations or drainage issues - for follow-up inspections or sharing with agronomists.
Mapping and Measuring Fields with Digital Tools
Digital mapping eliminates guesswork by using GPS coordinates and satellite imagery to define field boundaries. These maps form the foundation for decisions like calculating acreage for input orders or tracking treatment applications.
The real power of digital mapping lies in layering different data types. Side-by-side views allow you to compare hybrid performance with yield results in real-time, showing which seed varieties perform best in specific soil zones. Color-coded maps make it easy to see planting, spraying, and harvest records at a glance, providing a complete view of your field’s history and current status. This visual approach reveals patterns that spreadsheets or written notes might miss.
Real-time map building transforms how operators work. As equipment moves through the field, the map updates instantly, showing coverage and application rates as they happen. This immediate feedback helps prevent costly mistakes, such as gaps or overlaps in coverage. Yield monitors collecting data at 2-second intervals can capture around 200 measurements per acre, providing detailed insights down to 0.005 acres.
HarvestYield’s offline syncing feature ensures mapping continues even without cell service. GPS routes, weather data, and job progress are captured automatically and sync when connectivity is restored, eliminating the need for manual data entry. This ensures your maps stay accurate and up-to-date, no matter where your fields are located.
Connecting Data Sources for a Unified View
Bring all your data streams together in one dashboard using plug-and-play devices that sync field data via Bluetooth. This automation ensures every field pass is documented without requiring extra effort from operators.
Real-time data sharing between machines takes coordination to the next level. When multiple machines work the same field, they can share coverage maps and guidance lines, updating every 30 seconds. Machine positions refresh every 6 seconds, allowing managers to track progress and avoid over-application or missed areas. The "Join" feature syncs client, farm, field, and guidance line data across all displays, ensuring consistent records across the operation.
API connections and third-party integrations expand your data capabilities. Modern platforms connect with agronomic software, soil labs, weather stations, and equipment manufacturers, combining external data with your internal records. This broader context helps pinpoint what drives performance on your specific fields. For instance, overlaying yield maps with soil test results and weather patterns can reveal key factors affecting productivity.
Remote monitoring adds another layer of convenience. Features like "RemoteView" let you see what operators see in the cab from any internet-connected device. This visibility improves coordination and speeds up troubleshooting. While yield monitors can store between 15 and 45 hours of data depending on collection intervals, cloud syncing eliminates storage limits by transferring data directly to your central system.
Regular calibration ensures accuracy across all connected devices. At the start of each season, calibrate sensors for each grain type and re-calibrate if crop conditions change significantly. In tough conditions, clean moisture and yield sensors to prevent buildup that could lead to inaccurate readings. These steps ensure your dashboard reflects reality, not faulty or skewed data.
Using Real-Time Data for Better Decisions
With real-time data consolidated into a single dashboard, you can act on insights immediately. This centralized view allows you to identify issues early, make on-the-spot adjustments, and streamline decisions related to crop health, irrigation, and harvest planning. Instead of reacting to problems after they escalate, you can stay ahead of challenges and fine-tune operations as needed.
Monitoring Crop Health in Real-Time
NDVI (Normalized Difference Vegetation Index) is a powerful tool for assessing plant health and biomass. By analyzing the difference between near-infrared and red light reflectance, NDVI can detect even slight changes - just 1–2% - in vegetation density. Satellite-based NDVI imagery covers vast areas, capturing up to 10,000 acres in a single snapshot, giving you a full view of your operation.
Review NDVI maps weekly, or more often during critical growth phases. Comparing these maps with historical planting and application records helps pinpoint whether vegetation declines stem from environmental conditions or localized pest issues. You can also set threshold alerts for NDVI values, ensuring you’re notified the moment intervention is required.
In-field sensors complement NDVI by monitoring key factors like leaf wetness and humidity, which signal early signs of pest or disease pressure. These sensors generate millions of data points quarterly, enhancing the accuracy of machine-learning models.
To ensure your remote sensing data aligns with on-the-ground conditions, use field measurements like canopy temperature and chlorophyll index. High-definition imagery with GPS markers can highlight specific problem areas, making targeted scouting more efficient. Here’s a quick guide to interpreting NDVI readings and appropriate actions:
| NDVI Range | Vegetation Health Status | Management Recommendations |
|---|---|---|
| 0.1 – 0.3 | Poor / Stressed | Investigate pests, diseases, or nutrient deficiencies immediately |
| 0.3 – 0.5 | Moderate | Monitor closely; consider targeted fertilization |
| 0.5 – 0.7 | Good | Maintain current practices; fine-tune irrigation |
| 0.7 – 1.0 | Excellent | Continue optimal management; prepare for high yield |
Optimizing Irrigation and Fertilizer Application
Switching from fixed schedules to real-time, condition-based management can transform your irrigation and fertilization practices. Agriculture accounts for about 69% of global freshwater use, making efficient water management essential. AI-powered precision irrigation can cut water usage by up to 25% while boosting crop yields by 20–30%.
IoT-enabled soil sensors can measure key nutrients like nitrogen, phosphorus, and potassium, along with moisture levels, providing a reliable baseline for resource management. Integrating weather stations further enhances efficiency by adjusting irrigation schedules based on upcoming rainfall, preventing over-watering and nutrient runoff.
Variable-rate application (VRA) technology, guided by GPS, delivers water and fertilizer precisely where needed. By using NDVI maps to identify stressed zones, you can target inputs more effectively. AI-driven fertilizer optimization has been shown to increase yields by up to 20% while cutting input costs by 15%. Drip irrigation systems, which minimize water evaporation, can save 15–30% more water compared to traditional pivot or sprinkler systems.
Automated alerts can notify you of critical changes, such as low soil moisture or system anomalies like leaks detected through flow pattern analysis.
Improving Harvest Timing and Resource Management
Real-time grain moisture monitoring helps you avoid high drying costs and weather-related losses. Tracking Growing Degree Days (GDD) and crop growth stages allows for precise harvest scheduling, ensuring you schedule and track your team and equipment efficiently.
Daily satellite images and spectral data provide an up-to-date view of crop maturity, helping you prioritize fields based on actual conditions rather than estimates. In-field weather systems, which can be 350% more accurate than standard gridded data, are particularly valuable during critical periods like frost events, protecting crops during pre-harvest stages.
Real-time dashboards also track equipment metrics such as seed population, spray nozzle performance, and harvester downforce. This visibility helps minimize input waste and prevent equipment damage. Mobile alerts enable quick adjustments, while comparing real-time yield data across hybrids and management practices supports better resource allocation and future planning.
Sharing real-time insights and field notes with agronomists and field managers ensures everyone is aligned on harvest timing and resource needs. This collaboration reduces idle time and cuts down on fuel waste, making the entire operation more efficient.
Transform Your Agricultural Team
Streamline job management, field mapping, and machine tracking with HarvestYield. Simplify your operations and eliminate paper job sheets.
ContinueSetting Up Real-Time Dashboards for Farm Teams
After gathering real-time field data, the next step is to present it in user-friendly dashboards. A well-designed dashboard acts as a central hub, consolidating information from sensors, GPS trackers, and weather stations. This eliminates the hassle of juggling spreadsheets or relying on constant phone calls. The trick is to customize each dashboard to fit specific team roles: field operators need focused, in-cab displays, while managers benefit from a broader perspective for remote monitoring. This setup bridges the gap between raw data collection and actionable insights.
Creating Role-Based Dashboards
Different team members require dashboards tailored to their responsibilities. For field operators, in-cab displays are ideal, showcasing real-time metrics like seed population during planting or yield and moisture levels during harvest. These insights help operators quickly identify issues such as clogged nozzles or excessive downforce. Managers, on the other hand, need a high-level view to monitor operations on the go. Contractor dashboards can streamline tasks like offline job recording, instant invoicing, and maintaining unified machinery logs. During harvest, side-by-side map comparisons become especially valuable, allowing teams to analyze hybrid performance against yield data in real time. Additionally, sharing specific fields or entire operations with agronomists fosters collaboration and leads to better-informed decisions.
Enabling Mobile Access and Automated Alerts
Mobile access ensures your team can respond quickly to changing field conditions. Offline-enabled apps store GPS data and job progress locally, syncing automatically once connectivity is restored. This feature guarantees uninterrupted data capture, even in remote areas. Automated alerts are another essential tool. Notifications can be set up for critical thresholds, such as low soil moisture, pest activity, or equipment malfunctions, allowing teams to address issues before they escalate. Scouts can also use digital GPS pins to mark field problems during inspections and share them instantly with the team, speeding up response times.
Tracking Costs and Job Progress with HarvestYield
HarvestYield takes mobile and role-based dashboards a step further by integrating cost and progress tracking into one platform. Using GPS and timers, the system monitors work in real time, providing a clear map view of the field being worked and the machinery's route. This level of visibility ensures no areas are overlooked and jobs stay on schedule. HarvestYield also simplifies financial tracking by automatically calculating costs and billing based on pre-set activity rates, eliminating the need for manual data entry. A built-in machinery log records refueling, repairs, and servicing, consolidating all equipment-related expenses in one place. Once a job is completed, the platform generates a PDF invoice, complete with a field map, that can be emailed directly to clients or managers.
For those just starting, the free tier of HarvestYield covers up to 50 active acres. For larger operations, Starter covers up to 250 acres for $49 per month, with Pro and Business above that.
"A simple farm dashboard can improve collaboration between team members, as everyone can access the same data and communicate more effectively."
The platform also includes a "No GPS" mode, which allows manual entry of work data for tasks where location tracking isn’t required. This flexibility ensures that all types of fieldwork can be recorded digitally while keeping the benefits of centralized tracking intact.
Conclusion
Real-time data is a game-changer for farm management, turning guesswork into informed, proactive decision-making. Imagine catching a clogged nozzle during spraying before it wastes chemicals or adjusting irrigation on the fly based on live soil moisture readings. These immediate insights help prevent costly mistakes and improve efficiency, saving both time and labor.
Sharing this data with both field operators and managers creates a seamless flow of information, shifting operations from reactive to proactive. The platform centralizes tracking, monitors job progress, and calculates costs - all in one place. Even in remote areas without connectivity, the system keeps working offline, syncing data automatically later. Plus, it simplifies going paperless by generating invoices with detailed field maps, eliminating the need for manual job sheets.
Start small with digital field mapping, GPS-tracked jobs, and automated alerts. As your farm grows, scale up to include role-specific dashboards and sensor data for precise irrigation and fertility management. This approach reduces waste, optimizes resources, and gives you peace of mind, knowing exactly what's happening on every acre - even when you're not there. By adopting these strategies, you can take your field management and resource use to the next level.
FAQs
How does real-time field data help improve farm management decisions?
Real-time field data gives you immediate insights into how your farm is performing, enabling you to tackle potential problems before they start affecting your yield. Imagine this: GPS-enabled equipment streams live updates on things like seed population, moisture levels, or yield patterns as you work. This means you can quickly spot and address issues such as clogged nozzles or uneven planting without delay.
Take it a step further with tools like HarvestYield. These tools automatically link GPS coordinates, weather data, and field boundaries to your job records. The result? A detailed, searchable log of your planting, spraying, and harvesting activities. This makes it easier to compare field performance, create custom reports, and make smarter decisions - like adjusting fertilizer rates or planning irrigation schedules. By turning real-time data into actionable insights, you can improve efficiency, increase profitability, and build a more resilient farm.
What tools and technologies are needed to set up a real-time field data system?
Setting up a real-time field data system revolves around three main components: field sensors, connectivity hardware, and a cloud-based platform.
Field sensors - like weather stations, soil moisture probes, and yield monitors - are the backbone of this system. They gather critical data on factors such as temperature, soil moisture levels, and crop health, offering the raw insights needed to make informed decisions. To ensure this data gets where it needs to go, connectivity hardware steps in. Devices like in-cab systems and GPS receivers transmit data in real time, providing accurate location tracking and live updates straight from the field.
The final piece of the puzzle is a cloud-based platform. This platform consolidates all incoming data, transforming it into easy-to-read dashboards that highlight essential metrics like yields, input application rates, and equipment performance. Tools such as HarvestYield streamline the process further by syncing records, generating detailed reports, and offering a centralized view of operations. Together, these technologies empower farmers to act quickly and effectively, maximizing resources and boosting productivity.
How does real-time field data improve irrigation and fertilizer management on farms?
Real-time field data equips farm managers with up-to-the-minute details on soil conditions, weather patterns, and crop requirements. This level of precision allows for smarter irrigation scheduling, ensuring crops get exactly the amount of water they need. For instance, if soil sensors detect that a 12-inch soil layer contains only 0.15 inches of water, but the crop’s daily requirement is 0.30 inches, irrigation can be adjusted to address the shortfall. This method not only conserves water but also cuts energy costs and prevents overwatering.
In the same way, real-time data revolutionizes fertilizer management by pinpointing nutrient deficiencies in specific areas of a field. Tools like in-ground sensors and vigor maps enable the creation of variable-rate application plans, ensuring nutrients are applied precisely where they are needed most. This reduces waste, improves nutrient use, and trims expenses. Platforms such as HarvestYield combine GPS-tagged data, weather updates, and mapping tools, giving farm managers the ability to make informed, timely decisions while simplifying their operations.