How to Compare Seasonal Farm Yields Effectively
Want to boost farm profits? Start by analyzing your seasonal yields. Comparing yields across seasons helps farmers spot patterns, improve decision-making, and increase profitability. Even a 3% yield increase can add thousands of dollars to your revenue. The key is accurate data collection, standardization, and using tools like farm management software to simplify the process.
Here’s what matters most:
- Standardize measurements: Use bushels per acre and adjust for moisture to get clear, consistent data.
- Organize historical data: Sort by field, crop, and year for easy comparisons.
- Track seasonal factors: Record planting dates, fertilizer use, soil conditions, and weather data.
- Use yield maps: Visualize field performance to identify problem areas.
- Connect yields to costs: High yields don’t always mean high profits - track input expenses for better insights.
- Spot trends over time: Analyze 3–5 years of data to make smarter, long-term management decisions.
Farm management tools like HarvestYield simplify recordkeeping, mapping, and cost analysis, making it easier to turn data into actionable plans. By focusing on clean, consistent data and using it to guide decisions, you can improve yields and profits season after season.
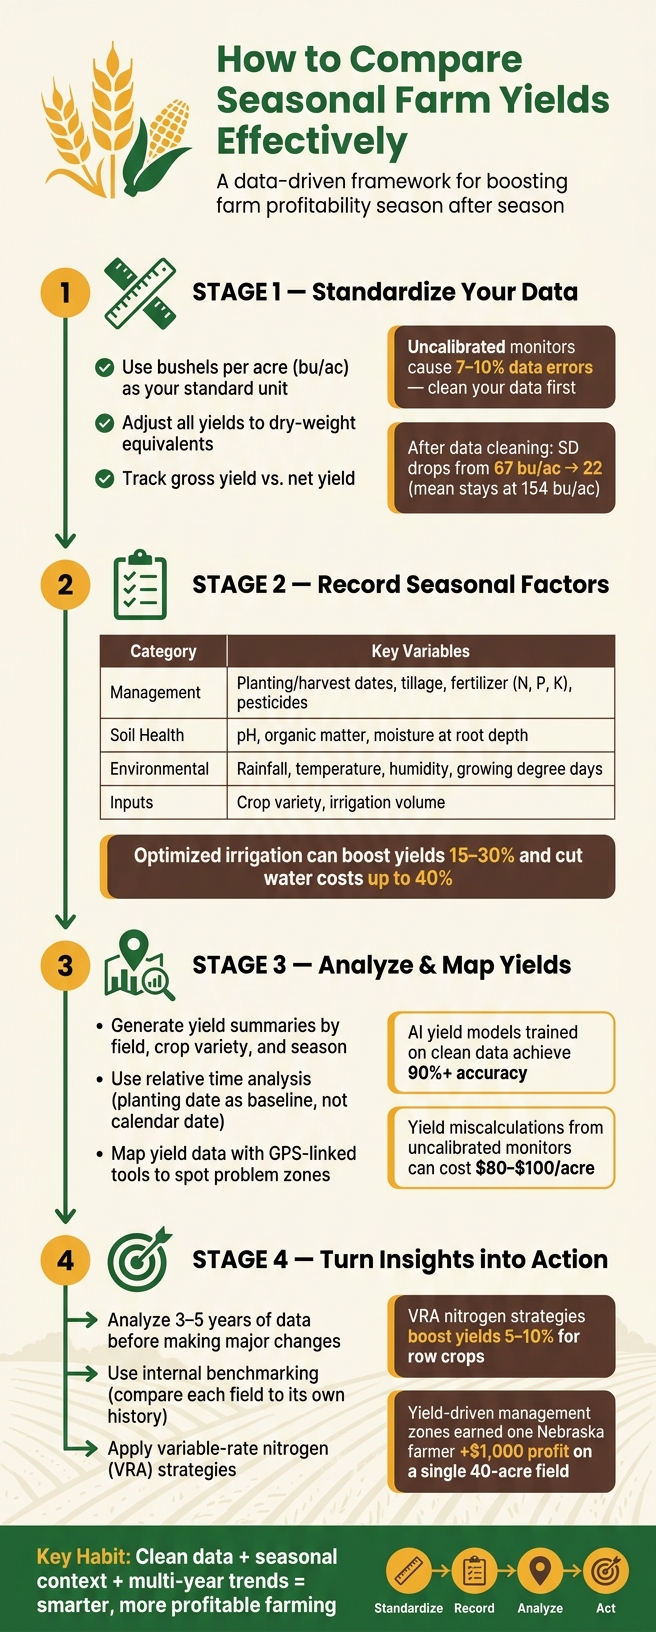
How to Compare Seasonal Farm Yields: A Step-by-Step Framework
Prepare Yield Data for Comparison
Standardize Yield Measurements
Before you dive into comparisons, it's crucial to standardize your yield data. In the U.S., bushels per acre (bu/ac) is the go-to unit for grain crops like corn, soybeans, and wheat. Sticking to this measurement across seasons ensures your comparisons are accurate and meaningful.
Don't overlook moisture content - it plays a huge role in getting a clear picture of your yields. Make sure to record moisture levels at harvest and adjust to dry-weight equivalents. This helps distinguish between gross yield (total harvested weight) and net yield (the marketable portion after spoilage and unmarketable crops are accounted for). Net yield gives you a more accurate reflection of your actual output.
Data quality can make or break your analysis. For example, uncalibrated grain yield monitors can introduce errors of 7% to 10%. Raw combine data is often riddled with spikes caused by speed changes, sharp turns, or header overlaps. A 2025 study from McPherson County, KS, highlights this issue: after cleaning harvester data, the standard deviation dropped from 67 bu/ac to 22 bu/ac, while the mean yield stayed steady at 154 bu/ac. This cleaned data provided a far clearer view of field variability.
Once your numbers are standardized, organizing your data becomes much simpler.
Organize Historical Yield Data
With consistent measurements in hand, structuring your data is the next step. Sort it by field name, crop variety, planting date, and harvest year to make comparisons easy. For instance, you’ll quickly be able to analyze how your north field's corn performed in 2023 versus 2025.
A solid data workflow is key. Start by importing raw files, verifying units and field boundaries, removing noise, calibrating against known totals, and then moving on to analysis. Following this process consistently every season ensures your records remain comparable over time.
This structured approach also sets the stage for better digital recordkeeping.
Use Digital Tools for Data Management
Managing yield data across multiple fields and seasons can get messy - but digital tools can help. Platforms like HarvestYield streamline the process. They allow you to define and store field boundaries with precision using GPS-based tracking, linking each harvest to specific locations and dates. Plus, weather data is automatically integrated, saving you the hassle of logging it manually.
"You can't manage what you can't measure: Get a full picture of your harvest, inventory, and yield." - Croptracker
HarvestYield also ensures all your records are stored digitally with cloud backups. This means you can easily access data from three years ago just as quickly as last week’s harvest log. Having an organized, searchable history makes year-over-year comparisons far more effective and actionable.
Record Seasonal Factors That Affect Yields
Tracking standardized data is just the beginning. To truly understand changes in yield, you need to record the conditions and decisions that shaped those outcomes. Context transforms raw numbers into insights that can drive better decisions. Without it, yield data is just a collection of numbers, lacking the meaning needed to act on it. Start by identifying and documenting the specific factors that influence your yield results.
Key Variables to Track
Several critical factors impact yield differences, and they generally fall into three main categories: management practices, soil health, and environmental conditions. For management, you’ll want to log planting and harvest dates, tillage methods, crop variety, fertilizer application rates (N, P, K), and pesticide use. On the soil side, keep track of pH levels, organic matter, and moisture at root depth - these directly affect nutrient availability for crops.
Environmental data is just as vital. Rainfall totals, temperature variations, humidity levels, and growing degree days all play a role and should be recorded alongside yield results. For example, overlaying rainfall data on yield maps can help you differentiate the effects of a dry July from changes in fertilizer application. Optimized irrigation alone has been shown to increase yields by 15–30% while cutting water costs by up to 40%.
Use Technology for Accurate Records
Manual record-keeping often leaves gaps, but technology can help fill them. Tools like HarvestYield automatically capture GPS and weather data during field operations, ensuring every task is accurately time-stamped and linked to a specific field and date. This creates a complete and structured record of your activities.
Reliable records are essential for making informed decisions over time. For instance, AI-driven crop yield models trained on real-time agricultural data have achieved accuracy rates exceeding 90%. This level of precision is only possible when the underlying data is clean and consistent. The same principle applies to farm-level tracking: the more thoroughly you document seasonal variables, the more valuable your year-over-year comparisons will be. Using a checklist can help ensure no important data point is missed.
Build a Seasonal Factors Checklist
Tracking the same variables consistently each season is crucial. A seasonal checklist helps you stay organized, even during the busiest times. At a minimum, your checklist should include management timing, input details, and environmental conditions throughout the growing season.
"What gets measured gets improved. Farms that track their data make better decisions over time and can identify what actually works for their conditions." - WiseYield Editorial Team
| Checklist Category | Key Variables to Track |
|---|---|
| Management Timing | Planting dates, harvest dates, tillage timing |
| Inputs | Fertilizer (N, P, K), crop variety/hybrid, irrigation volume, pesticides |
| Environmental | Rainfall, temperature, humidity, growing degree days |
| Soil Health | pH, N-P-K levels, organic matter, moisture at root depth |
Another often-overlooked detail is recording quality grades alongside yield weights. For instance, knowing a field produced 180 bu/ac is less useful if you don’t know whether that yield was premium-grade or processing quality. Capturing this data every season helps you identify which crop varieties consistently deliver high-value results - not just high volumes.
Analyze and Compare Seasonal Yields
With standardized data and seasonal factors recorded, the next step involves diving into the numbers. Farm management software makes this process easier by turning raw data into side-by-side comparisons that can drive smarter decisions.
Generate Yield Summaries
Start by organizing your yield records by crop type, variety, and growing season. Most farm management tools allow you to set specific date ranges, ensuring historical data doesn’t interfere with your current analysis. Once filtered, you can create summaries that break down yield per acre by field, crop variety, or even planting location.
A particularly effective method is relative time analysis. Instead of comparing yields based on calendar dates, this approach uses the planting date as the starting point. For example, it allows you to compare two corn varieties planted weeks apart on equal terms, as the timeline begins when the seeds go into the ground - not on January 1.
However, before relying on these summaries, ensure your harvester data is properly cleaned and calibrated. Uncalibrated monitors can introduce errors of 7%–10%, which might lead to yield miscalculations of 10–20 bushels per acre - potentially costing $80–$100 per acre.
Map Yield Data Across Fields
Tables are helpful for crunching numbers, but yield maps bring those numbers to life. By plotting yield data visually across your fields, you can quickly identify areas that consistently perform above or below average. Tools like HarvestYield integrate GPS data for precise mapping, making it easy to pinpoint specific zones. For example, you might discover that a low-lying section of a field suffers from flooding, or that a sandy ridge struggles to retain moisture during the summer.
When yield monitor data is incomplete due to equipment issues, advanced platforms can step in with synthetic yield maps. These maps use historical field data and remote sensing to fill in the gaps, ensuring you still get a clear picture of field performance.
These visual insights are invaluable for assessing how your farming practices and input costs affect overall profitability.
Connect Yields to Costs and Practices
Yield maps are just the start. The next step is linking yield data to input costs. After all, high yields don’t always translate to high profits. A field might produce an impressive yield, but if that required extra nitrogen, additional irrigation, or more machine hours, the higher costs could eat into your margins. The key figure to focus on is the cost per unit of yield - how much did it cost to produce each bushel?
To get this number, match your yield data with input costs like fertilizers, irrigation, and machinery expenses for each field. For instance, if one field shows higher yields but also significantly higher input costs, it might indicate lower profitability. HarvestYield simplifies this process by tracking machine costs alongside job records, making it easier to connect yields to their associated expenses and practices.
A 2021 case study from Nebraska Extension CropWatch highlights the potential of this approach. By using yield-driven management zones for variable-rate nitrogen application, a farmer earned an additional $1,000 in profit on a single 40-acre field compared to a flat-rate application. This shows how aligning yield data with costs and practices can lead to smarter, more profitable decisions.
Transform Your Agricultural Team
Streamline job management, field mapping, and machine tracking with HarvestYield. Simplify your operations and eliminate paper job sheets.
ContinueTurn Yield Insights into Action Plans
Spot Multi-Year Trends
Relying on a single season's yield data can be misleading. Factors like drought, heavy rains, or pest infestations can skew results. That’s why it’s essential to analyze three to five years of data before making major changes to your management practices.
"It takes three to five years of data before you should start making major management changes. Especially in a corn-soybean rotation, you need multiple seasons to see real patterns." - Dennis Bowman, Digital Agriculture Specialist, University of Illinois Extension
The key is to identify consistent trends and avoid overreacting to one-off events. For instance, if a specific field zone struggles during dry years but recovers in wet conditions, the issue might be related to soil moisture rather than poor management. On the other hand, if that zone underperforms every year, regardless of weather, it’s a clear sign of a persistent problem. Use internal benchmarking to evaluate how each field performs over time, comparing it against its own history rather than regional averages. This approach provides a clearer picture of your land's specific challenges and helps guide precise changes for better results.
Adjust Farm Practices Based on Data
Once you’ve identified a genuine trend, the next step is determining what adjustments to make. Yield analysis can help pinpoint specific areas for improvement. It’s not just about chasing high yields - it’s about balancing those yields with input costs to maintain profitability. For example, if your nitrogen use efficiency (NUE) data reveals excess nitrogen in a particular zone after harvest, you can reduce your N application in that area next season instead of applying a uniform rate across the field.
Take Ohio farmer Zoe Kent as an example. In 2024–2025, she used yield maps to identify 1.2 acres of border strips near a wooded edge that consistently lost money. Instead of continuing to invest in those unprofitable acres, she enrolled them in the Conservation Reserve Program (CRP). This kind of targeted, data-driven decision-making is exactly what yield analysis enables. Similarly, implementing variable-rate nitrogen (VRA) strategies based on yield data can boost yields by 5%–10% for crops like potatoes, and this method works well for other row crops too.
Build a Seasonal Planning Framework
Once you’ve turned your insights into actionable trends, it’s time to formalize them into a structured plan. A clear, documented strategy ensures you stay organized and ready to act. Tools like HarvestYield simplify this process by consolidating job records, field maps, and machine cost data, making it easier to create and maintain your plan. Here’s an example of how to structure your findings:
| Finding | Evidence | Planned Change | Implementation Season |
|---|---|---|---|
| Consistently low yield in NW corner | 3-year yield maps + soil test showing low pH | Variable rate lime application | Fall 2026 |
| Unprofitable border strip near woods | Profit map showing -$120/acre margin | Enroll in CRP | Spring 2027 |
| High nitrogen surplus in Zone 2 | NUE report showing unused N after harvest | Reduce N rate by 15% in Zone 2 | Spring 2027 |
| Variety B outperformed Variety A | Side-by-side yield comparison (+8 bu/ac) | Shift 70% of acreage to Variety B | Spring 2027 |
Every change listed in this framework is backed by solid evidence, ensuring your decisions are informed and effective. By using tools like HarvestYield, you can centralize your data and keep your plan updated as new information becomes available. This creates a dynamic document that evolves with each season, helping you stay ahead of challenges and opportunities.
Conclusion and Key Takeaways
Tracking and comparing seasonal farm yields is a process that pays off over time. As we've discussed - from ensuring consistent measurement methods to creating structured seasonal planning frameworks - each step becomes more valuable as your data accumulates. Clean, reliable data across multiple seasons is the foundation for making smarter, more informed decisions on the farm.
Some key habits stand out: using standardized measurement units when recording harvests, keeping track of seasonal factors that impact outcomes, and analyzing multi-season trends. These are the practices that shift farming from being reactive to being proactive. With accurate data, you're better equipped to protect your profits.
Platforms like HarvestYield can amplify these efforts. By centralizing job records, field maps, GPS data, and machinery costs, HarvestYield simplifies the process of identifying patterns, building seasonal strategies, and acting on insights - without the hassle of sifting through paper records or scattered spreadsheets. Studies on yield management zones show that structured data collection and thorough analysis can lead to profit gains that far surpass the results of guesswork.
The farmers who see the greatest benefits from yield analysis aren't necessarily those with the largest farms. Instead, it's those who treat their data like a long-term investment, review it regularly, and use it to make steady improvements season after season. By consistently evaluating your seasonal data and adjusting your strategies, you can set yourself up for sustainable profitability year after year.
FAQs
How do I adjust yield for moisture correctly?
To calculate yield adjusted for moisture, use this formula: Adjusted Yield = Actual Yield × (100 - Actual Moisture) ÷ (100 - Target Moisture).
For example, if you have 1,000 pounds of grain at 25% moisture and want to adjust it to a target of 15%, the adjusted yield would be 882.35 pounds. Always ensure your moisture meters are properly calibrated to achieve accurate measurements.
What yield data should I clean before comparing seasons?
To make comparisons reliable, it's crucial to clean raw data by eliminating inaccuracies. This includes filtering out extreme values (both unusually high and low), overlapping harvester passes, curved paths, and zero-value readings. Pay attention to artifacts like turn movements, stops, data recorded beyond field boundaries, and delays in signals. Additionally, ensure grain flow and moisture sensor readings are consistent, and exclude data points logged with incorrect header status or outside the calibrated velocity range.
How do I tie yield changes to profit, not just bushels?
To link yield changes directly to profit, combine financial data with production records to figure out net margins. Begin by calculating your cost of production per bushel, factoring in expenses like fertilizer, labor, and other inputs. Then, use software tools to overlay these costs onto yield maps, helping you pinpoint areas that may not be turning a profit. Tools like HarvestYield can centralize job histories and expenses, making it easier to align your yield goals with financial objectives rather than just concentrating on output alone.