Field Mapping with UAV Soil Moisture Data
Soil moisture mapping is transforming farm management. UAVs (drones) equipped with advanced sensors like L-band radiometers, ground-penetrating radar (GPR), and multispectral cameras provide high-resolution data (3–50 meters). This data helps farmers identify water stress or saturation zones with Map My Field, improving irrigation efficiency and saving resources.
Key Takeaways:
- Precision: UAVs bridge the gap between localized sensors and low-resolution satellite imagery.
- Savings: Farmers can save $27–$45 per acre and boost yields by 8–15%.
- Technologies:
- GPR: Measures moisture up to 50 cm deep but requires expertise.
- L-band Radiometers: Penetrate vegetation and measure 2–10 cm depth, ideal for all-weather use.
- Multispectral Imaging: Detects surface moisture and vegetation health but is weather-sensitive.
- Applications: UAV data supports targeted irrigation, reducing water waste by up to 40%.
UAV soil moisture mapping is now a cornerstone of modern agriculture, offering actionable insights for better field management and resource allocation.
Precision Soil Moisture Monitoring with L-band Drone Mapping
Transform Your Agricultural Team
Streamline job management, field mapping, and machine tracking with HarvestYield. Simplify your operations and eliminate paper job sheets.
ContinueUAV Technologies for Soil Moisture Detection
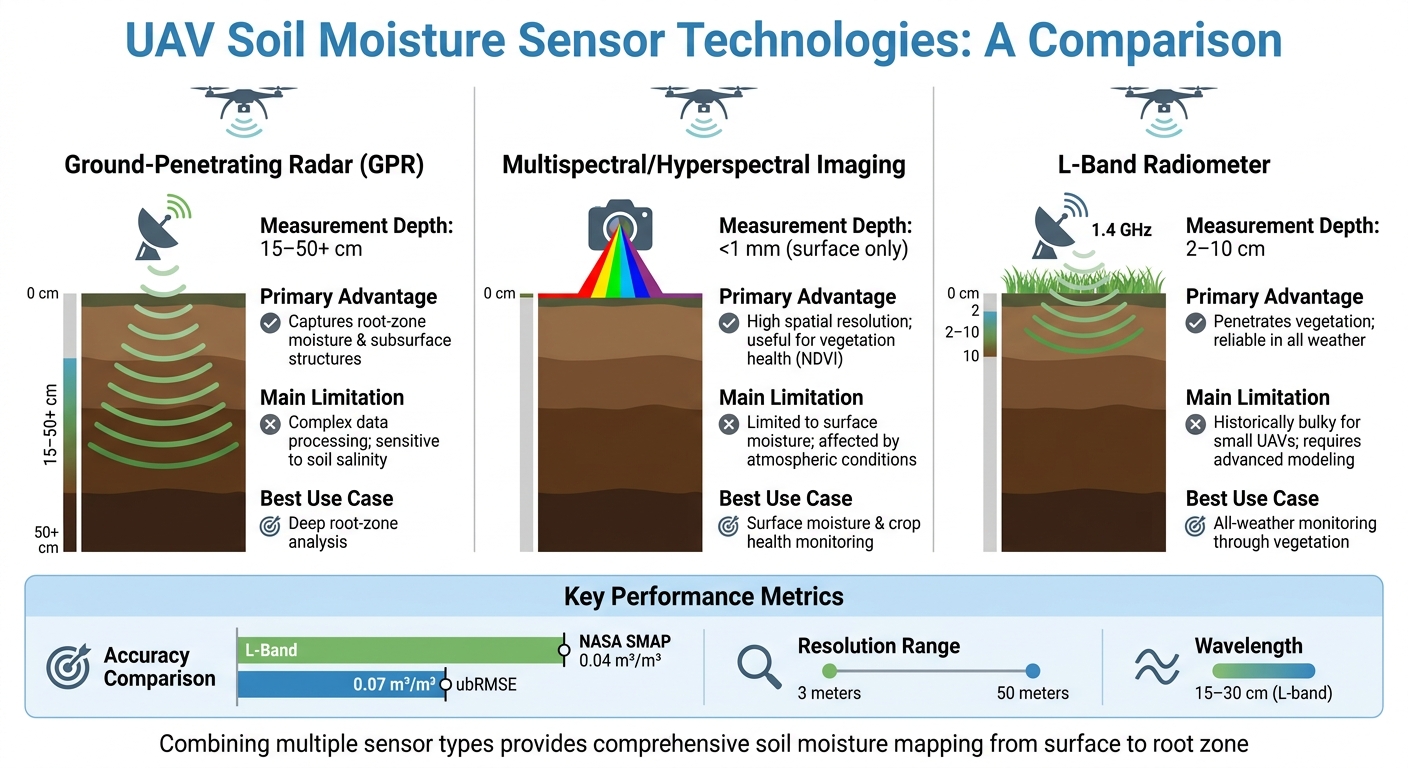
UAV Soil Moisture Sensor Technologies Comparison Chart
UAV-mounted sensors provide data on both surface and root-zone soil moisture, but choosing the right technology depends on your farm’s specific requirements. Understanding these tools can help you make an informed decision.
Drone-Borne Ground-Penetrating Radar (GPR)
Ground-Penetrating Radar (GPR) uses low-frequency waves to penetrate the soil, reaching depths of 15 to over 50 cm depending on the frequency. This technology is highly effective for detecting root-zone electrical conductivity and subsurface moisture.
In February 2025, Sébastien Lambot and his team at UCLouvain conducted a study at the Selhausen test site in Germany. They deployed a multi-sensor drone system that combined GPR for root-zone analysis, L-band Synthetic Aperture Radar (SAR) for surface moisture, and multispectral imaging for crop properties. The results showed that integrating these data streams could capture soil and crop variables across different scales, advancing precision agriculture.
However, GPR has its challenges. It is sensitive to soil salinity, and processing the data requires specialized expertise. Despite these drawbacks, when paired with surface-level sensors, GPR delivers a detailed view of moisture distribution from the surface to the root zone.
Hyperspectral and Multispectral Imaging
Hyperspectral and multispectral sensors measure soil reflectance, with moist soil appearing darker due to water absorption. These sensors primarily analyze the top millimeter of soil.
"The spectral soil surface reflectance within the visible (Vis), near-infrared (NIR), and shortwave infrared (SWIR) EM range decreases with increasing SM content." - Reviews of Geophysics
Multispectral imaging is particularly powerful for calculating vegetation indices like NDVI (Normalized Difference Vegetation Index), which helps correct L-band radiometer data for vegetation interference.
The limitation? These sensors only detect surface moisture and are influenced by atmospheric conditions. They work best when combined with technologies that can measure deeper soil layers.
L-Band Radiometers
L-band radiometers operate at a frequency of 1.4 GHz, with wavelengths between 15 and 30 cm. This allows them to penetrate moderate-density vegetation and capture signals from 2 to 10 cm below the soil surface. Unlike optical sensors, L-band radiometers are unaffected by clouds or darkness, making them ideal for all-weather data collection.
"L-band radiometer data is widely accepted as the most commonly used microwave band to estimate soil moisture... due to the ability to retrieve a signal below the soil surface (even through moderate-density vegetation)." - Stern et al., Frontiers in Remote Sensing
For example, the Pepperwood Preserve study achieved an average unbiased root mean squared error of 0.07 m³/m³ using UAV-mounted L-band radiometers. The study mapped soil moisture at resolutions between 3 and 50 meters, approaching the accuracy of NASA’s SMAP satellite program (0.04 m³/m³) but at a much finer field scale.
Combining these sensor outputs enhances the accuracy of field moisture mapping.
| Technology | Measurement Depth | Primary Advantage | Main Limitation |
|---|---|---|---|
| GPR | 15–50+ cm | Captures root-zone moisture and subsurface structures | Complex data processing; sensitive to soil salinity |
| Multispectral/Hyperspectral | < 0.04 inches (1 mm) | High spatial resolution; useful for vegetation health (NDVI) | Limited to surface moisture; affected by atmospheric conditions |
| L-Band Radiometer | 2–10 cm | Penetrates vegetation; reliable in all weather | Historically bulky for small UAVs; requires advanced modeling |
How to Collect and Analyze UAV Soil Moisture Data
Once you've chosen the right sensor technology, the next step is ensuring your UAV soil moisture data collection goes smoothly. Proper preparation and careful execution are key - small missteps in planning or flight settings can compromise the entire mission.
Pre-Flight Preparation and Calibration
Start by checking your UAV's batteries. For instance, if you're using a DJI Matrice, ensure all batteries are at the same firmware version and charge level to avoid voltage discrepancies.
"Acquiring high-resolution data is a critical step for precision agriculture applications." – Sri Charan Kakarla, Engineering and Research Technologist at UF/IFAS.
Sensor calibration is non-negotiable. For multispectral sensors, take images of radiometric calibration panels both before and after each flight. If you're using L-band radiometers, frequent recalibration is necessary to account for environmental temperature changes. This prevents data inconsistencies caused by sensor drift.
Timing your flights is equally important. Fly between 10:00 AM and 2:00 PM to minimize shadows and avoid temperature extremes that could distort thermal or L-band sensor readings. Always verify data quality immediately after the flight using a laptop and card reader. If issues arise, re-fly the mission while you're still on-site. To simplify post-flight processing, mark ground-based soil moisture sensors with tall flags for easy identification.
With calibrated equipment and an ideal flight window, you're ready to configure flight parameters for accurate data collection.
Data Collection Techniques
Your flight settings - altitude, speed, and overlap - play a big role in determining the quality of your maps. For agricultural mapping, 70–80% frontlap and sidelap is a common choice. Keep in mind that higher altitudes cover more area but reduce resolution, so balance your need for coverage with the level of detail required.
A great example of this in action comes from a project conducted between May 2022 and May 2023. Researchers from the U.S. Geological Survey and Black Swift Technologies flew three campaigns over the 13 km² Pepperwood Preserve in California. Using S2 fixed-wing and E2 multirotor UAVs equipped with L-band radiometers and Altum multispectral sensors, they collected soil moisture data at resolutions ranging from 3 to 50 meters. By applying a radiative transfer model that corrected for vegetation (via NDVI) and surface roughness, they achieved an accuracy of 0.07 m³/m³ ubRMSE, validated against 419 field TDR measurements.
To conserve battery life, plan flight paths that minimize turns and start as close to the UAV's takeoff point as possible - this can save up to 5% of battery capacity. Also, keep tablets and mobile devices shaded during operations, as overheating can disrupt communication and cause data loss.
Once your data is collected, the next step is processing and visualizing the results.
Processing and Visualizing Data
Raw images need to be stitched into orthomosaics and georeferenced before they can be analyzed. Remove non-flight images to streamline processing. Keep in mind that high-resolution UAV data demands significant storage - about 3 GB per 50 acres. Using an external SSD or cloud storage can speed things up.
To retrieve soil moisture data, you'll use a radiative transfer model like the tau-omega model. This method combines L-band brightness temperature, surface roughness, and vegetation density (calculated from NDVI) to generate accurate results.
"Calibration of the data is an important step that must be followed for accurate results." – Sri Charan Kakarla and Yiannis Ampatzidis, University of Florida.
Focus on generating only the maps you need to save time during processing. These final outputs can then be integrated into GIS systems or farm management software to create prescription maps, which are essential for tasks like variable rate irrigation or fertilization.
Integrating UAV Soil Moisture Data into Field Mapping
Building on earlier discussions of sensor technology and data processing, integrating UAV soil moisture data with other geospatial layers can significantly enhance field mapping.
Combining UAV Data with Other Geospatial Layers
When you layer UAV soil moisture data with other geospatial information, you create a more detailed and actionable field profile. Each data source adds a new perspective, helping you make more informed decisions.
For example, you can combine subsurface moisture readings from Ground Penetrating Radar (GPR) with surface-level data from hyperspectral and thermal imaging. This approach provides a 3D understanding of field conditions that single-sensor systems can't achieve. Thermal sensors, for instance, capture canopy temperature and surface moisture stress, while GPR dives deeper, offering insights into subsurface moisture levels.
AI-powered data fusion tools simplify the process by integrating these layers automatically, resulting in unified soil moisture maps. Adding Digital Elevation Models (DEM) can further enhance these maps by revealing drainage patterns, while satellite data from platforms like Landsat or Sentinel ensures temporal continuity between UAV flights. Together, these multi-layered maps offer a foundation for precise, zone-specific field management strategies.
Practical Applications in Farm Management
Once you have these integrated maps, translating them into actionable strategies becomes straightforward. They open up opportunities for optimizing various aspects of farm management.
Take variable rate irrigation (VRI) as an example. Instead of applying water uniformly across the entire field, soil moisture maps allow you to create prescription zones, directing water only to areas that need it. This not only conserves water but also avoids over-irrigation in already moist regions.
Between 2021 and 2022, researchers at PMAS-Arid Agriculture University in Rawalpindi, Pakistan, demonstrated this concept effectively. Using UAVs with multispectral sensors, researchers S. Hussain and Muhammad Jehanzeb Masud Cheema calculated the Water Stress Index (WSI) for peanut crops. They then fed this data into a Random Forest machine learning model, accurately predicting soil moisture at a depth of about 6 inches (15 cm) with an R² of 0.97 to 0.99. These detailed maps identified moisture stress hotspots, enabling targeted irrigation that conserved water while maintaining yields.
The same principle applies to fertilizer and pesticide use. Moisture-stressed areas often align with nutrient deficiencies, so soil moisture maps can guide variable rate fertilizer spreaders to deliver nutrients precisely where they're needed. Similarly, identifying wet zones can help you avoid spraying pesticides in areas where they might wash away before taking effect.
"Soil moisture maps provide quantitative information that, along with climate and energy balance, is critical to integrate with hydrologic processes for characterizing landscape conditions." – Michelle Stern, U.S. Geological Survey
Using HarvestYield for UAV Soil Moisture Data Management
Simplify your daily operations by organizing UAV soil moisture data with HarvestYield. This platform acts as a centralized hub, linking UAV data directly to specific field records. By building on earlier UAV data processing methods, HarvestYield ensures that each field’s moisture profile is ready for practical use.
Mapping and Measuring Fields with UAV Data
Accurate digital field boundaries are essential for effectively integrating UAV soil moisture data. With HarvestYield, you can create these boundaries in three ways: driving the perimeter with a GPS-enabled device, walking the edge, or manually placing pins on aerial imagery within the app. The platform then calculates acreage automatically and overlays UAV data onto these geospatial maps.
The precision of your field maps depends heavily on the GPS equipment used. Here’s a quick breakdown:
- Consumer-grade GPS: Offers 10–16 ft accuracy, suitable for general mapping.
- Sub-meter GPS: Provides 1–3 ft accuracy, ideal for boundary mapping and logging job locations.
- RTK GPS: Delivers pinpoint precision of 0.4–1.2 in, perfect for permanent boundaries or drainage mapping where UAV data must align with physical features.
Once your fields are mapped, you can layer UAV soil moisture data with other geospatial information already stored in HarvestYield. This allows you to create management zones that guide targeted applications of water, nutrients, or pesticides - helping you make better irrigation and nutrient management decisions. Each field gets a unique identifier (like “North Corn Field”), and all related UAV data, scouting notes, and photos link directly to the field record for easy traceability.
By establishing accurate digital boundaries, you’re setting up a system for precise record keeping and smoother field operations.
Streamlining Data Transfer and Record Keeping
HarvestYield eliminates the need for paper job sheets by sending digital instructions straight to operators’ mobile devices. These instructions include field maps and UAV moisture data layers, ensuring everyone stays on the same page. During operations, the system automatically logs GPS coverage, timestamps, and weather conditions, allowing you to track progress and confirm field coverage without manual input.
Data syncs seamlessly across devices through cloud storage, and offline operation is supported with automatic syncing when reconnected. You can also attach metadata - such as mapping dates, GPS accuracy, and collector names - to each moisture dataset. This not only simplifies record keeping but also helps meet USDA, FSA, and crop insurance requirements, which often mandate retaining digital records for 5–7 years.
To avoid confusion when syncing UAV data with existing records, establish a consistent field naming convention (e.g., “Farm Name - Field ID”) and ensure all tools use the same coordinate reference system, like WGS84 or UTM zones. Additionally, update your digital field maps annually - before planting season - to account for any changes like drainage work, new land acquisitions, or infrastructure updates.
Conclusion
UAV soil moisture data is transforming field mapping into an essential tool for smarter farm management. By combining high-resolution imagery with thermal and multispectral sensors, farmers can uncover hidden moisture patterns, enabling more precise irrigation strategies. Studies indicate that using UAV-guided moisture data for precision irrigation can increase crop yields by up to 20% while cutting water usage by as much as 40%. These insights directly contribute to better irrigation decisions and improved productivity.
Beyond irrigation, paperless workflows are streamlining every step of the farming process - from planting to spraying to harvesting - by linking them to exact field locations. Digital platforms not only reduce errors from manual data entry but also provide an auditable record for USDA, FSA, and crop insurance compliance. For platforms like HarvestYield, this level of data accuracy is essential. With multispectral sensors now a standard feature on most precision farming UAVs, this technology has become a cornerstone of modern agriculture.
HarvestYield takes this a step further by seamlessly integrating UAV moisture data with field records, GPS logs, and job documentation. This isn’t just about collecting data - it’s about building a multi-year database that highlights consistent management zones and supports Variable Rate Application (VRA) strategies. Precision mapping powered by UAV data can improve cost efficiency by 30–50% compared to traditional methods. By turning raw data into actionable insights, this approach drives long-term efficiency and smarter decision-making.
FAQs
Which UAV sensor should I choose for my field’s soil moisture mapping needs?
Multispectral sensors are perfect for gathering detailed information about soil and crop health. On the other hand, thermal sensors are great for spotting moisture problems and signs of crop stress, especially across larger fields. The right choice depends on your field's size, your specific requirements, and how much you're willing to spend.
How do I ground-truth and validate UAV soil moisture maps for accuracy?
To ensure the accuracy of UAV-generated soil moisture maps, it's essential to compare these maps with in-field soil moisture measurements. These measurements can be gathered using standard probes or sensors, offering a reliable benchmark. Sampling from multiple locations across the area being studied improves the reliability of the comparison.
For assessing accuracy, metrics like unbiased root-mean-square error (ubRMSE) are commonly used. Additionally, applying Bayesian uncertainty methods can help quantify the confidence in the UAV data. These methods are particularly useful for pinpointing areas that might need further calibration or additional validation efforts.
How often should I fly UAV moisture missions to support variable rate irrigation decisions?
Flying UAV moisture missions should be done as often as necessary to keep irrigation adjustments precise and timely. The frequency largely depends on factors such as the crop's growth stage, changing weather conditions, and variations in soil composition. While there isn’t a one-size-fits-all schedule, tailoring your monitoring to these factors ensures better irrigation management. Regular checks are key to staying ahead.