Ultimate Guide to Machine Utilization Tracking
Understanding how often equipment is working, idling, or in transit is key to cutting unnecessary costs and boosting productivity. Farms using tracking systems often increase machine efficiency by 15–20% and reduce downtime by 30%. With unplanned downtime costing up to $260,000 per hour, these improvements can make a big difference.
Here’s what you’ll learn:
- What machine utilization is: Breaking down hours into working, transport, and idle time.
- Why it matters: It helps save fuel, improve maintenance schedules, and make better fleet decisions.
- How to track it: From manual logs to advanced tools like GPS-enabled software.
- Key metrics to monitor: Utilization rate, field capacity, fuel consumption, and maintenance trends.
- Practical steps: Use data to reduce idle time, optimize fuel use, and plan smarter investments.
Tracking systems like HarvestYield automate data collection, offering real-time insights into machine performance. Start small - track a few machines, set benchmarks, and expand to your full fleet. With the right approach, you can reduce waste, extend equipment life, and make informed decisions that impact your bottom line.
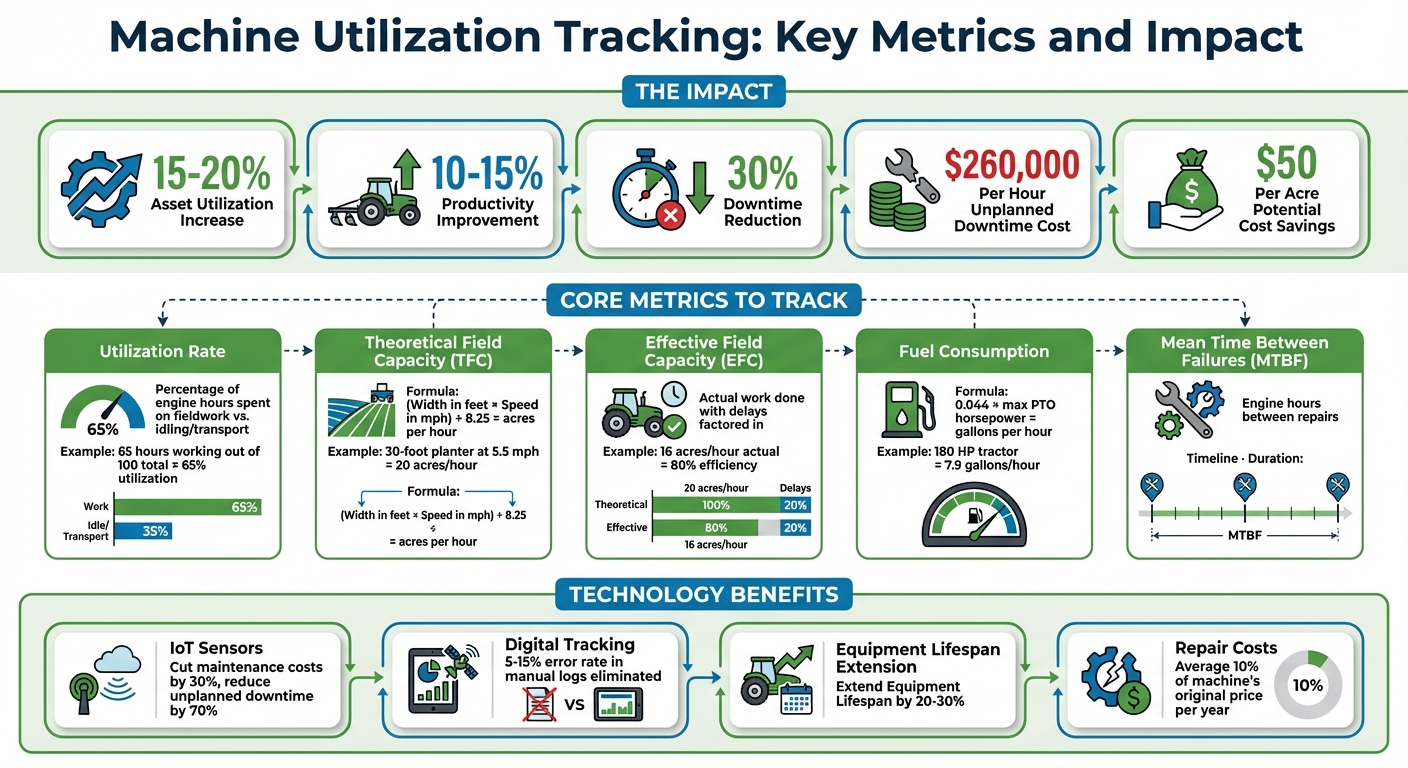
Machine Utilization Tracking: Key Metrics and Impact Statistics
Key Metrics for Measuring Machine Utilization
Core Machine Utilization Metrics
Turning engine hours into meaningful data is key to understanding how effectively your equipment is being used. One essential metric is the utilization rate, which measures the percentage of total engine hours spent on actual fieldwork versus idling or transport. For example, if a combine operates for 100 hours but only spends 65 of those working, its utilization rate is 65%.
Another critical calculation is Theoretical Field Capacity (TFC), which estimates the maximum work rate a machine can achieve. The formula is straightforward:
(Width in feet × Speed in mph) ÷ 8.25 = acres per hour.
For instance, a 30-foot planter traveling at 5.5 mph has a TFC of 20 acres per hour.
On the other hand, Effective Field Capacity (EFC) measures the actual work done, factoring in delays like turning, refilling, and other interruptions. If the same planter averages 16 acres per hour, its efficiency is 80% (16 ÷ 20 × 100). This metric provides a more realistic view of how efficiently the equipment is performing in the field.
Fuel consumption is another key metric to track, typically measured in gallons per hour. A general estimate for diesel usage is 0.044 times the machine’s maximum PTO horsepower. For example, a 180-horsepower tractor would consume about 7.9 gallons per hour. Additionally, cost per machine hour is calculated by dividing total annual ownership costs (like depreciation, interest, and insurance) plus operating costs (fuel, repairs, and labor) by the total hours the machine is used.
By using these metrics, managers can measure equipment performance and compare it to industry standards.
Setting Benchmark Ranges for Equipment
Knowing your numbers before problems arise is essential. Resources like Iowa State extension tables or your own historical data can help set realistic performance targets for various types of equipment. For example, if similar planters typically achieve field efficiencies between 75% and 85%, a machine operating below this range signals the need for further investigation. Effective equipment management can lower costs by as much as $50 per acre.
Fuel consumption benchmarks are another valuable tool. Compare your actual usage against the formula (0.044 × horsepower). If a tractor consistently burns more fuel than expected, it might be an indication that it’s oversized for the task at hand. Labor hours also need to be factored in, as they often run 10% to 20% higher than machine field time due to travel and servicing. Including this in your benchmarks ensures you set realistic expectations for overall productivity.
Maintenance and Downtime Tracking
Efficiency isn’t just about how fast or how much a machine can work - it’s also about minimizing downtime. Monitoring maintenance trends helps avoid unplanned breakdowns that can disrupt operations and hurt profitability. One way to do this is by tracking Mean Time Between Failures (MTBF), which records the engine hours between repair events. For example, if a sprayer requires servicing every 200 hours instead of the expected 400, it’s a sign of potential issues that need attention before a critical failure occurs. Scheduling inspections based on engine hours can help reduce unexpected downtime.
"Minimize potential downtime by scheduled recommended inspections."
- Maria Goretty, Southwest Region Agronomist, RDO Equipment Co.
Repair costs are another important factor to monitor. On average, total ownership costs account for about 10% of a machine’s original price per year. While repair expenses might be low initially, they can climb quickly over time. For instance, a tractor may accumulate repair costs equal to 25% of its original price after 6,000 hours of use. Additionally, lubrication costs typically make up about 15% of total fuel expenses, so keeping an eye on these details is also important.
Methods for Capturing Machine Utilization Data
Manual Data Collection
The traditional way of tracking machine usage involves handwritten logbooks, paper timesheets, and manual hour meter readings. While these methods are straightforward and come with low upfront costs, they’re prone to error - studies show error rates between 5% and 15%. Plus, relying on paper records makes it nearly impossible to analyze trends in real time or communicate effectively with teams. It’s no surprise that these limitations have led many to explore digital alternatives.
Digital Data Collection Tools
Modern technology has transformed how machine utilization data is gathered. Tools like Modular Telematics Gateways (MTG) automatically track metrics such as engine hours, fuel levels, RPM, and engine load factors, significantly boosting data accuracy. RFID technology, which doesn’t require a direct line of sight, is perfect for managing multiple assets in busy equipment yards. For simpler needs, QR codes and barcodes offer an affordable way to handle equipment check-ins and safety checks.
IoT sensors take things a step further by monitoring vibration, temperature, and operational hours, enabling predictive maintenance. These systems can cut maintenance costs by up to 30% and reduce unplanned downtime by as much as 70%. Companies that adopt equipment tracking systems often see a 15% to 20% boost in asset utilization rates.
Using HarvestYield to Streamline Data Capture
Digital tools not only automate data collection but also integrate into platforms like HarvestYield, which simplifies the process even further. Designed with a mobile-first approach, HarvestYield works seamlessly across various equipment fleets without requiring specialized hardware. By integrating real-time data capture, the platform enhances the accuracy of utilization metrics while building on the core tracking methods mentioned earlier.
Operators can use their smartphones to log job details, GPS paths, and consumables such as fuel or bales in real time. The app automatically records metrics like distance, average speed, duration, and precise start/finish times. Every 10 minutes, it drops location pins, allowing managers to monitor progress remotely. Even in areas with weak signals, the data is stored locally and synced once the connection is restored.
Take Houlston Contracting in North Yorkshire, for example. In January 2020, the company switched from paper timesheets to HarvestYield to manage up to 12 seasonal workers during silage season. The digital system provided real-time tracking of hours worked and consumables used, while also offering insights into machinery health. During a diesel issue, the app helped confirm that a set of filters had only logged 189 hours. As Steven Houlston explained:
"The app made it easy to see when the last filter change was. On one machine, a set of filters had only done 189 hours".
HarvestYield also centralizes all equipment-related data, including repairs, servicing schedules, and refueling events. Users receive push notifications for upcoming maintenance tasks based on actual engine hours rather than arbitrary calendar dates. Additionally, geo-notes allow operators to record GPS-linked observations - such as field hazards, wet areas, or gate codes - to assist future users.
Building a Machine Utilization Workflow
Inventorying Machines and Defining Job Types
Start by creating a detailed catalog of all your equipment. Include essential details like the type, make, model year, color, purchase or lease date, and serial number. To track costs accurately, add the purchase price, depreciation rate, and starting engine hours. If possible, import this data directly from your telematics system to save time and reduce errors.
Once your inventory is set, standardize job categories such as tillage, planting, harvesting, and transport. This consistency ensures smoother data entry and analysis. Using digital asset tags to group equipment by type or location can help you compare efficiency across different areas of your operation. A thorough inventory like this lays the groundwork for effective tracking and performance monitoring.
Implementing a Centralized Tracking System
Using a centralized platform, like HarvestYield, can simplify data management across your operation. Add all relevant details - activities, clients, fields, and machines - to the system. Then, schedule jobs and assign equipment accordingly. Operators can log activity details in real time through a mobile app, with automatic syncing whenever an internet connection is available.
Enable connectivity services to automatically sync engine hours and location data. Set utilization thresholds for each machine, such as a target idle percentage, to quickly identify underperforming equipment. As Maria Zepeda from RDO Equipment Co. advises:
"If the load factor indicates a smaller machine can do the job efficiently, do not waste warranty hours on your larger tillage tractors."
Reviewing and Acting on Utilization Data
Once your data is centralized, regular reviews are key to improving efficiency. Use established metrics to analyze engine hours, fuel consumption, and usage patterns (Working, Idle, Transport). High idle times, for instance, may signal issues with operator practices or scheduling.
Leverage these insights to make adjustments. If transport hours are driving up fuel costs and warranty usage, consider whether hauling equipment on a trailer could save resources. Monitoring engine load factors can also ensure you're matching the right machine to the task. Running a large tillage tractor at low capacity, for example, wastes both fuel and engine hours. As Maria Goretty from RDO Equipment Co. points out:
"By learning about your fleet's utilization and having open conversations with operators, the manager can determine if they are fully benefiting tractors' capabilities."
Transform Your Agricultural Team
Streamline job management, field mapping, and machine tracking with HarvestYield. Simplify your operations and eliminate paper job sheets.
ContinueFarms Machinery Management Excel Template Step-by-Step Video Tutorial by Simple Sheets

Using Utilization Insights to Drive Efficiency
Utilization insights turn raw data into practical strategies for improving how resources are managed and used.
Reducing Idle Time and Improving Field Efficiency
Once you establish baseline metrics, cutting down idle time becomes a direct way to increase productivity. Utilization reports break engine hours into categories like working, transport, and idle time, making it easier to spot machines or operators exceeding idle percentage targets. Instead of just tracking overall fleet hours, focus on idle data to identify specific areas for improvement.
Idle time isn’t just about lost productivity - it costs money. By factoring in fuel consumption and warranty hour depletion, you can calculate the financial impact of idling. Engine speed reports can also help you identify the best RPMs to avoid wasting fuel. These insights not only help reduce idle time but also improve overall fuel efficiency and maintenance practices.
Optimizing Fuel Usage and Maintenance Costs
Keeping an eye on load factors and RPMs ensures that equipment operates at the right power levels, avoiding unnecessary fuel use and wear. Maria Goretty, Southwest Region Agronomist at RDO Equipment Co., highlights this point:
"Operators running the tractor at an optimal engine speed help the entire farm manage fuel consumption."
Set specific idle goals for your fleet and use utilization reports to identify operators who might need additional training. If transport hours are driving up your costs, analyze the expenses tied to fuel, labor, and warranty hours from moving equipment on roads. This kind of analysis can help you decide whether using trailers or hiring custom haulage might be a better option than driving machines between fields.
By addressing these operational costs, you can free up resources for smarter investments guided by your fleet’s historical data.
Using Historical Data for Investment Decisions
Utilization records offer valuable insights when it comes to equipment investments. For example, tracking engine hours helps you monitor warranty expiration limits, allowing you to time replacements strategically and maximize trade-in value. Engine load factor data can also reveal whether high-horsepower equipment is being underused, helping you avoid over-investing in future purchases.
Before buying new equipment, review utilization reports to identify underused assets that could be redeployed, cutting down on unnecessary capital expenses. A great example comes from ACV Enviro, a U.S. environmental services company. They installed automated tracking on over 1,000 pieces of equipment. Transitioning from spreadsheets to detailed utilization reports helped them make smarter budgeting decisions, ultimately reducing costs by relying less on rentals.
Conclusion
Tracking machine utilization isn't just about crunching numbers - it's about turning raw data into smarter decisions and real savings. With the right tracking systems, you can boost asset utilization by 15–20%, improve productivity by 10–15%, and cut downtime by up to 30%. Considering unplanned downtime can cost an average of $260,000 per hour, these improvements can make a massive difference.
Start by choosing consistent metrics, whether it's cost per acre or cost per hour, and stick to them. As Mary Anne Mullen, Vice President of Credit at AgDirect, emphasizes:
"Whether you measure profitability by cost per acre or cost per hour, the key is choosing a metric, being consistent and evaluating your costs regularly".
Focus on gathering key data points like engine hours, fuel consumption, idle time, engine load factor, and RPM data. These metrics provide a clearer picture of how equipment is performing and where adjustments can be made.
Digital tools can take this process to the next level. Platforms like HarvestYield eliminate the hassle of manual logbooks and spreadsheets, which are prone to delays and errors. Instead, operators can use GPS tracking to log jobs, record area values in real time, and even generate invoices directly from mobile devices - even in areas with limited connectivity. This reduces paperwork and ensures more accurate billing.
If you're just getting started, begin small. Track a few high-impact machines, establish a month of baseline metrics, and then expand to your entire fleet. Keep an eye on idle percentages to spot fuel waste, check engine load factors to ensure the right equipment is being used for the job, and set maintenance alerts based on engine hours rather than arbitrary schedules.
The real value of utilization data lies in using it proactively. With the right system, you can locate equipment faster, make informed investment decisions, and even extend the lifespan of machinery by 20–30%. By applying these insights, farm managers can unlock better machine performance and achieve long-term operational success.
FAQs
How do I start tracking machine utilization on my farm?
To start monitoring machine usage on your farm, the first step is setting up your HarvestYield account. Begin by entering essential details like your fields, equipment, and tasks. Then, download the HarvestYield app on your iOS or Android device and log in. Once everything is set up, choose the specific job you want to monitor and use the app to track real-time data while operating your machinery.
As you work, the app automatically records key details such as start time, location, and speed. You can pause or stop tracking whenever necessary. After finishing the job, you can finalize the data by adding important details like the number of acres worked, fuel consumption, or any downtime. All this information is synced to your HarvestYield dashboard, where you can analyze metrics such as total hours worked, operational efficiency, and acreage completed. It's an effective way to gain insights and fine-tune your farm operations.
What key metrics should farm managers track to improve machine efficiency?
To keep machines running efficiently, farm managers should pay close attention to these key metrics:
- Fuel consumption: Track how many gallons are used per hour or per acre. This can reveal inefficiencies, help cut costs, and even reduce engine wear over time.
- Utilization rate: Measure the balance between operating hours and idle time. A higher utilization rate means your equipment is spending more time working and less time sitting idle.
- Downtime and maintenance: Record unplanned breakdowns and stoppages. Keeping tabs on downtime makes it easier to plan preventive maintenance and avoid expensive repairs down the road.
- Field coverage: Monitor how many acres a machine covers per hour during tasks like planting or harvesting. This helps evaluate performance and ensures operations are running at the right speed.
- Cost per hour/acre: Add up fuel, labor, and maintenance expenses, then divide by operating hours or acres worked. This shows the true cost of using each machine.
By staying on top of these metrics, farm managers can pinpoint inefficiencies, make smarter decisions, and keep operations running smoothly - all while keeping costs in check.
How can tracking machine utilization help reduce costs on the farm?
Keeping tabs on machine utilization offers a wealth of insights into equipment usage. It helps pinpoint idle time, track fuel consumption, and predict maintenance needs. By tackling these areas, farm managers can organize tasks more effectively, cut down on fuel and labor costs, and minimize unnecessary wear on machinery.
Taking a proactive approach to managing equipment not only helps avoid expensive breakdowns but also extends the life of the machines. This translates into reduced expenses and smoother, more efficient farm operations overall.