Ultimate Guide to Repair Cost Tracking
Repair costs can drain farm profit fast, and the fix starts with tracking every repair the same way. If I want better control, I need to log all repair costs, sort them by machine, measure cost per hour and per acre, map your fields to ensure accurate data, and compare spending against a seasonal budget.
Since 2020, farm repair costs have climbed about 41%. In some cases, downtime during planting or harvest can run $500 to $2,000+ per hour. That means a repair is not just a parts bill. It can also include labor, service fees, shop supplies, and lost field time.
Here’s the short version of what matters most:
- I need to track six cost types: parts, in-house labor, outside service, shop supplies, service-call fees, and downtime
- I should exclude fuel, insurance, registration, and depreciation
- Every machine needs a clear ID and every repair needs a same-day log entry
- The main numbers to watch are repair cost per hour, repair cost per acre, and repair cost per job
- I should split repairs into preventive and corrective work
- A simple repair budget can be based on past machine history and checked against actual spending each season
- High-cost machines, repeat failures, and climbing downtime are signs to review whether to repair, overhaul, or replace
This article lays out a plain system I can use to track repair spending, cut wasted money, and make better equipment calls with data instead of guesswork.
Farm Equipment Maintenance Log
Transform Your Agricultural Team
Streamline job management, field mapping, and machine tracking with HarvestYield. Simplify your operations and eliminate paper job sheets.
ContinueHow to Build a Repair Cost Tracking System Your Team Will Use
A repair tracking system only works if people can log work fast, the same way every time, and without extra hassle.
Set Up a Machine List and Standard Data Fields
Start with a full list of every machine on the farm: tractors, combines, trucks, and implements. Give each machine a unique ID and use the same format across the board. For example:
- Tractors: TR-001 John Deere 8R 280
- Combines: CB-001 Case IH 8250
- Trucks: TK-001 Freightliner Cascadia
- Implements: IM-001 Great Plains 30' Drill
Put physical labels on each machine so operators can grab the right ID fast when they’re out in the field. It also helps to assign one person - usually the office manager or maintenance lead - to approve new IDs and stop duplicate IDs before they cause a mess.
Each machine should have two kinds of records. First, the machine profile, which stores the basic background data:
| Data Category | Fields |
|---|---|
| Machine Identity | Machine ID, Make, Model, Year, Serial Number |
| Financial Baseline | Purchase Price ($), Purchase Date |
Second, the repair log, which tracks each repair event as it happens:
| Data Category | Standard Fields |
|---|---|
| Repair Details | Date (MM/DD/YYYY), Description, Work Order #, Job ID or Field ID |
| Cost Metrics | Parts Cost ($), Labor Hours, Labor Rate ($/hr), Total Cost ($) |
| Usage Tracking | Hour Meter or Odometer Reading, Operator Name |
This setup makes it much easier to calculate repair cost per hour or per acre later.
Set Rules for Logging Repairs in Real Time
The rule should be simple: every repair gets logged the same day it happens.
That sounds basic, but it matters. If people wait until the end of the week, details disappear. A loose hose turns into “some hydraulic issue.” An hour-meter reading gets missed. Then your records stop being useful.
Split the work by role so no one has to do everything:
- Operators log the breakdown the same day: date, machine ID, hour-meter or odometer reading, field name, and a short issue description
- Shop mechanics or the maintenance lead add parts cost, labor hours, labor rate, and total cost, with receipts attached
- The farm manager or office staff reviews entries each week and flags anything missing
One rule can keep the whole system in line: do not approve parts or labor without a matching repair entry.
That single step helps turn logging from a “nice to have” into part of the job.
Digital records also help keep those same-day entries tied to each machine’s history.
Use Digital Records to Connect Jobs, Fields, and Machine History
Paper logs and scattered spreadsheets make it tough to see the full cost of a repair. A note written in the cab can end up nowhere near the parts invoice. When that happens, figuring out the true cost of a breakdown becomes a chore.
Digital platforms built for farm teams fix that by tying repairs to machines, jobs, and field locations in one place. HarvestYield is built for this kind of workflow. Operators can log job and machine details in the field, including GPS location. Mechanics and managers can then fill in cost data from the shop or office. Repairs and service events go into the same machine history and stay available across iOS, Android, and web.
That connected record helps you spot patterns faster. Maybe one machine keeps driving the most repair spend. Maybe breakdowns pile up around a certain job or season. When all the records live together, those patterns stop hiding in separate files.
Linked repair records also make reporting faster and cost tracking easier.
Those linked records make the next step - turning logs into cost numbers - much easier.
How to Turn Repair Logs Into Useful Cost Numbers
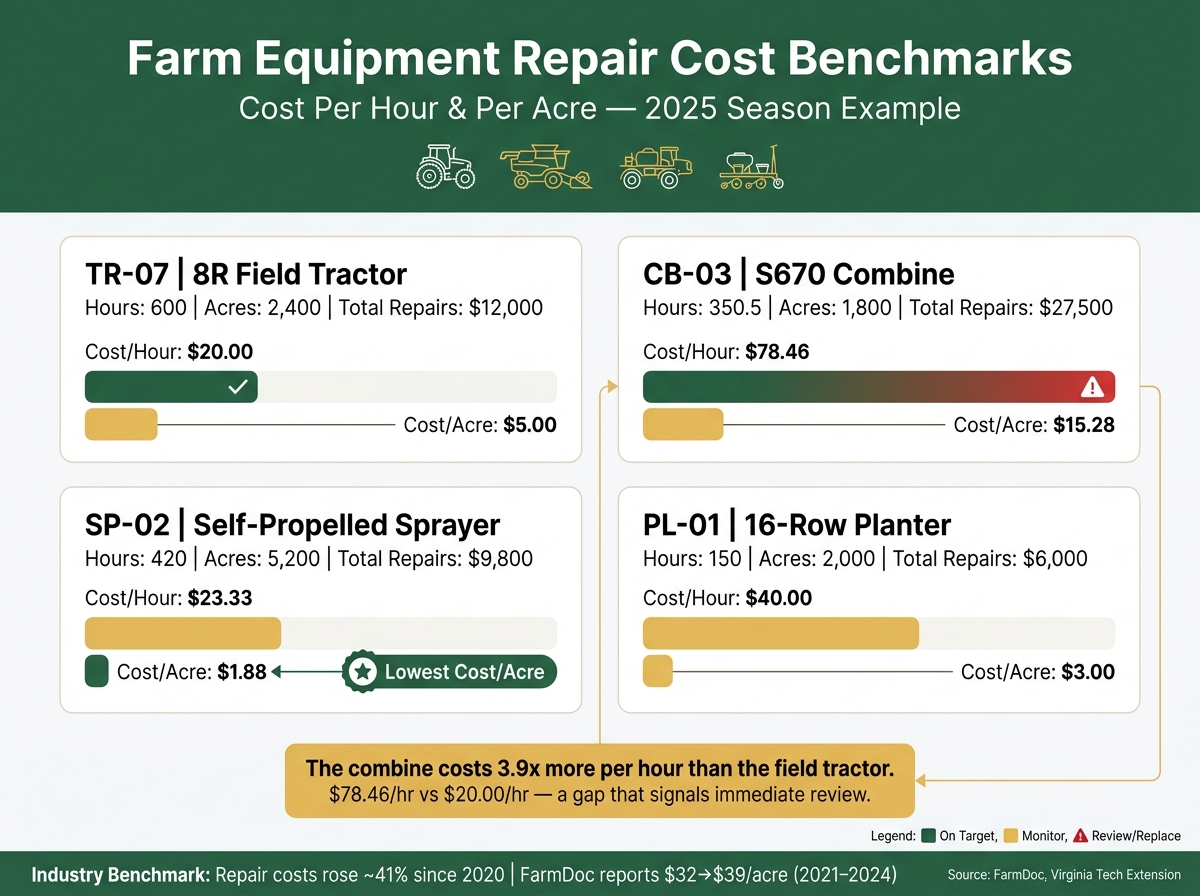
Farm Equipment Repair Cost Benchmarks: Cost Per Hour & Per Acre by Machine Type
The goal here is simple: turn repair logs into machine-level cost rates you can actually use. Once repair events are logged the same way every time, you can compare costs across machines, seasons, and jobs without guessing.
Calculate Repair Cost per Hour, per Acre, and per Job
Most farm managers only need three formulas:
- Repair cost per hour = Total repair cost ÷ Total machine hours (same period)
- Repair cost per acre = Total repair cost ÷ Total acres covered (same period)
- Repair cost per job = Total repair cost linked to a job ÷ Number of units completed (for example, acres, loads, or fields)
Use the same time window for every machine. Last calendar year works. Last crop season works too. What doesn’t work is comparing a full year for one tractor to a single season for a combine. That will throw off the numbers fast.
A side-by-side table helps you spot outliers right away:
| Machine ID | Description | Hours (2025) | Acres (2025) | Total Repairs (USD) | Cost/Hour (USD) | Cost/Acre (USD) |
|---|---|---|---|---|---|---|
| TR-07 | 8R field tractor | 600.0 | 2,400 | $12,000 | $20.00 | $5.00 |
| CB-03 | S670 combine | 350.5 | 1,800 | $27,500 | $78.46 | $15.28 |
| SP-02 | Self-propelled sprayer | 420.0 | 5,200 | $9,800 | $23.33 | $1.88 |
| PL-01 | 16-row planter | 150.0 | 2,000 | $6,000 | $40.00 | $3.00 |
The combine jumps off the page at $78.46 per hour, compared with $20.00 per hour for the field tractor. That kind of gap tells you where to look first. High-hour machines often end up with the highest repair cost per hour.
Track Preventive and Corrective Repair Costs Separately
Not all repair spending means the same thing. Preventive costs - scheduled oil changes, filter replacements, pre-season inspections - are planned. You can budget for them. Corrective costs - like a hydraulic hose blowing during planting or a final drive failing in the middle of harvest - show up without warning and usually hit harder.
When you track those two buckets apart, the story gets much clearer. If corrective costs are climbing, that usually points to older equipment, tighter maintenance intervals, or both.
The easiest setup is a Repair Type field in each log entry:
- P for preventive
- C for corrective
Over a full season, that lets you total each category by machine and compare the pattern year over year. HarvestYield can standardize repair type, machine, and time-period fields. That split helps you see whether spending is going toward protecting uptime or scrambling after breakdowns.
Build a Seasonal Repair Budget and Track Budget vs. Actual
Once you know what repairs have been costing, you can turn that into a budget target. Start with three to five years of repair history for each machine, then adjust for age and total hours. A common starting benchmark is 2–7% of purchase price per year for repairs and maintenance. That’s a decent gut check, but your own logs will beat any rule of thumb.
A practical way to handle this is to use last season’s totals to set next season’s budget, then compare budget to actual spending after each major season:
| Machine / Category | Budget (USD) | Actual (USD) | Variance (USD) | Variance (%) |
|---|---|---|---|---|
| TR-07 – Field tractor | $10,000 | $12,500 | +$2,500 | +25% |
| CB-03 – Combine | $28,000 | $31,200 | +$3,200 | +11% |
| SP-02 – Sprayer fleet | $15,000 | $13,400 | -$1,600 | -11% |
| PL-01 – Planter | $6,500 | $5,800 | -$700 | -11% |
A positive variance means you spent more than planned. A negative variance means repair costs came in below budget. Reviewing this after each major season gives you a clean checkpoint, so you can make changes before costs start snowballing.
How to Use Repair Data to Make Better Maintenance and Replacement Decisions
Good repair records do more than show what failed. They help you see what’s most likely to fail next. After a few seasons of steady recordkeeping, you can stop reacting to breakdowns and start planning around them.
Find High-Cost Machines and Repeated Breakdown Patterns
One of the clearest signs that a machine is turning into a problem is a steady jump in repair cost per hour over two or three seasons. If a combine averages $6.00 per hour in repairs one year and then climbs to $13.33 per hour the next, that’s not random bad luck. That’s a pattern.
Cost matters, but it’s not the only warning sign. Repeated failures on the same part often point to a deeper issue that a quick fix won’t solve. Three hydraulic hose failures in one season, or the same sensor fault showing up again and again on one unit, usually means something upstream is off. It also helps to track downtime hours per event. A breakdown during planting or harvest doesn’t just cost money on paper. It cuts field capacity right when timing is tight.
Flag any machine that hits one or more of these markers:
- Repair cost per hour is more than 50% above your fleet average
- It had three or more major breakdowns in the past 12 months
- Failures are happening more often
When machine, job, and field records are linked, these peak-season trouble units stand out fast.
Once you’ve flagged them, use that list to set the next maintenance window. From there, you can decide whether the machine needs closer watching or a full replacement review.
Schedule Preventive Maintenance Around Hours, Miles, and Seasons
After you identify problem machines, the next step is simple: schedule service before the next heavy-use period.
Your repair history gives you something the manual can’t. It shows when your machines tend to fail, under your field conditions, with your operators. Let’s say past records show combine header bearings usually fail between 1,200 and 1,400 hours. In that case, it makes sense to inspect and replace them at 1,150 hours, a few weeks before harvest, instead of rolling the dice mid-season.
Use those past failure points to set inspection dates and service windows before each machine heads into its busiest stretch.
A good working rhythm is to review records after each major season, such as post-planting, post-harvest, and post-spray. Then build the service list from what the data shows. Deferred repairs, near-failure signs, and temporary fixes can all be turned into planned off-season work while the machine is out of the field.
Decide When to Repair, Overhaul, or Replace a Machine
If preventive work doesn’t improve reliability, it’s time to shift from maintenance planning to straight replacement math.
One big repair bill shouldn’t decide the fate of a machine. The better way is to look at the trend across several years. Are annual repair costs going up? Is downtime getting worse? Does the machine still match the farm’s current workload?
That’s the lens to use when deciding whether a unit should stay in service, get an overhaul, or be replaced.
The table below turns that into a simple framework:
| Machine | Age (Years) | Annual Repair Cost | Annual Downtime (Hours) | Hours Used per Year | Replacement Signal |
|---|---|---|---|---|---|
| Tractor A | 6 | $3,200 | 12 | 750 | Keep & maintain |
| Tractor B | 11 | $9,800 | 65 | 680 | Consider overhaul; monitor next 2 years |
| Combine C | 14 | $18,500 | 90 | 500 | Strong candidate for replacement |
| Sprayer D | 8 | $4,600 | 20 | 600 | Keep; plan targeted preventive repairs |
Use this kind of side-by-side view to weigh repair trend, downtime, and yearly use before choosing repair, overhaul, or replacement.
Conclusion: A Simple Framework for Better Repair Cost Control
After you define costs, log repairs, and set budgets, the next step is pretty simple: build a steady routine around five habits. Define your cost categories. Standardize your machine records. Log every repair when it happens. Calculate cost per hour and cost per acre on a regular basis. Then compare actual spending with your budget. Do that every time, and repair records stop being paperwork. They start guiding decisions.
The data shows why this matters. FarmDoc reports that repair costs climbed from $32 to $39 per acre between 2021 and 2024, which is a nearly 22% increase in only three years. That kind of slow drift can slip by if you’re not tracking it. With a system in place, you can spot it early and respond before it turns into a bigger hit to your budget.
Virginia Tech Extension offers a clear example. An $80,000 tractor may rack up about $24,000 in repairs over 5,000 hours with average maintenance, versus about $18,000 with excellent service management. That spread makes the point. Better logging and better maintenance can lead to lower repair costs over the life of the machine.
When repair records are tied to machine history, the numbers become a lot easier to use. Platforms like HarvestYield can connect repair logs to jobs, fields, and machine hours, so you can see cost-per-hour and cost-per-acre figures without digging through scattered notes. Good records give you a clear view. A clear view means fewer surprises. And fewer surprises help with cash flow, budgeting, and calls on whether a machine should stay in the fleet, get overhauled, or be replaced.
The farms with the tightest control usually know, down to the machine, what it costs to keep equipment running - and they act before small issues turn into expensive ones.
FAQs
How detailed should repair logs be?
Repair logs need enough detail to support accurate cost analysis and day-to-day decisions.
For each repair, record:
- The machine
- The part that was replaced or the issue that was fixed
- Labor time
- The cost tied to the job
In HarvestYield, you can save this information with service descriptions and part numbers. That makes it easier to separate routine maintenance from unexpected breakdowns.
It also helps you spot machines that are becoming too expensive to keep in service.
What if my team forgets same-day entries?
If your team skips same-day entries, you can lose 20% to 50% of key details. That’s why cost recording needs to be a required daily task, not something people plan to do later and never quite get to.
HarvestYield lets operators log repairs, materials, and machine hours from their phones as part of the daily routine. To keep records clean, review random days with your team and run quick weekly checks against labor hours or fuel invoices.
When should I replace instead of repair?
Base the decision on data, not age alone. If your yearly spending on repairs, downtime, and fuel is getting close to - or going past - the cost of a newer, more efficient machine, it’s probably time to look at a replacement.
A common rule of thumb is simple: replace the equipment if a repair estimate is more than 50% of its current market value. It also makes sense to replace a machine when it no longer fits your needs, breaks down too often, or when the long-term savings are likely to beat the upfront cost of upgrading.