How Drones Detect Crop Diseases with Imaging
Drones help me find crop stress early by scanning the whole field, mapping hot spots, and showing where I should walk before I spray. In many cases, RTK-guided flights can mark spots within about 4 inches, and thermal or reflectance data can show stress before I see clear damage from the ground.
Here’s the short version:
- Drones do not diagnose disease by themselves. They show stress patterns.
- RGB helps with visual checks, but it usually misses early stress.
- Multispectral helps me track plant vigor with tools like NDVI and NDRE.
- Thermal helps me spot hotter canopy areas where plants may be under stress.
- Hyperspectral can separate narrow spectral patterns, but it brings heavy data work and high cost.
- Flight quality matters. I need stable light, enough image overlap, and repeatable calibration.
- Image processing matters too. Stitching, radiometric correction, and index maps help turn raw files into field maps.
- Ground checks are still the final step. I use the map to inspect leaves, stems, soil, and nearby healthy rows before I make a treatment call.
- Good records help over time. If I log weather, growth stage, GPS points, and follow-up notes, I can compare flights by date and field. This helps me track my work across different seasons.
A few points stand out. NDVI can lose sensitivity in dense canopies, so a tool like WDVI Green may work better after canopy closure. And when I combine reflectance + canopy temperature, I get a stronger reason to scout a zone instead of guessing from one signal alone.
Quick Comparison
| Sensor | What I use it for | Main upside | Main limit | Cost level |
|---|---|---|---|---|
| RGB | Visual scouting, stand checks, basic maps | Lower cost, easy to read | Misses early invisible stress | Low |
| Multispectral | Early stress, chlorophyll changes | Uses bands like NIR and Red Edge | Needs calibration; some indices saturate | Moderate |
| Thermal | Heat stress, lower transpiration, early infection signs | Shows canopy temperature shifts | Sensitive to weather and time of day | High |
| Hyperspectral | Fine spectral separation for disease work | Many narrow bands | Large files, harder processing | Very High |
If I had to boil it down to one line, it’s this: the drone finds where to look, but the field check decides what to do next.
Transform Your Agricultural Team
Streamline job management, field mapping, and machine tracking with HarvestYield. Simplify your operations and eliminate paper job sheets.
ContinueChoose the right imaging system for disease detection
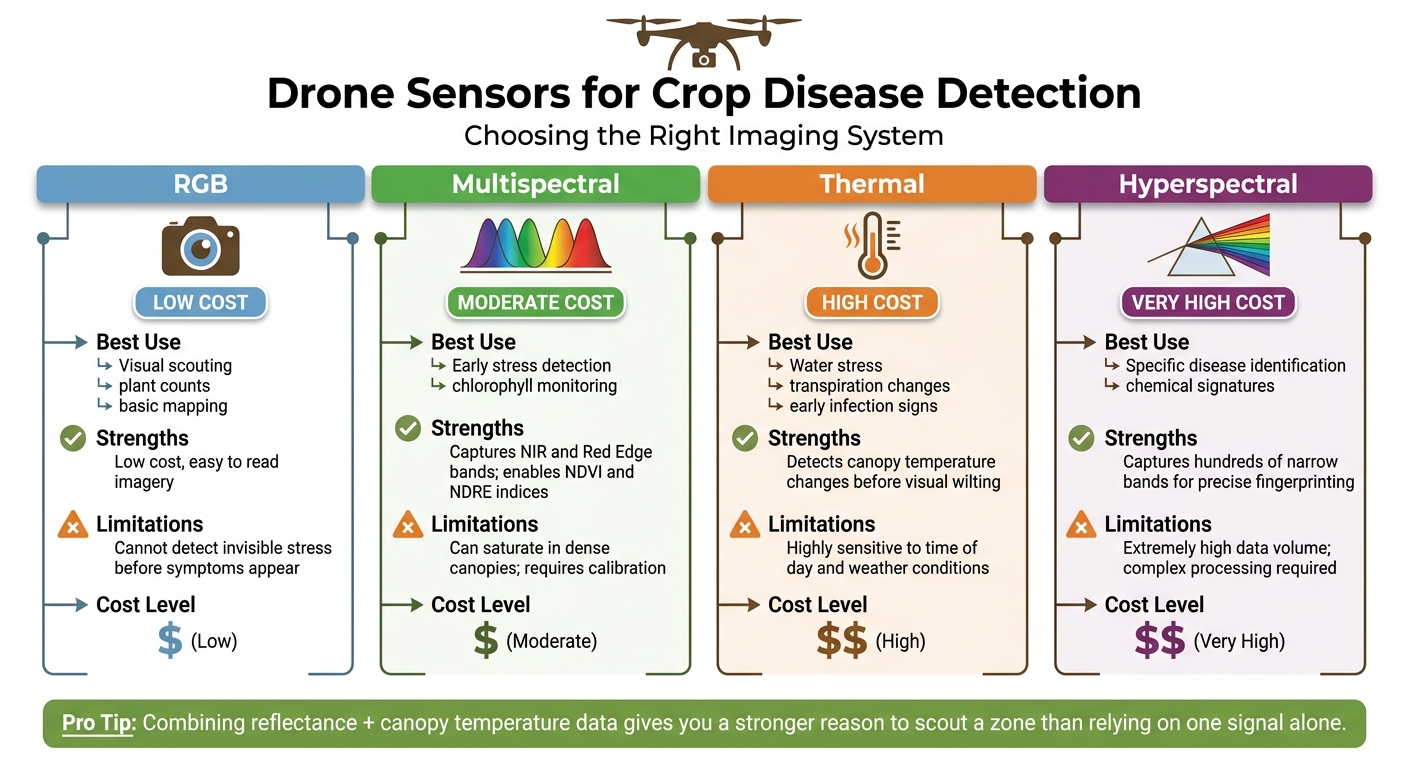
Drone Sensors for Crop Disease Detection: RGB vs Multispectral vs Thermal vs Hyperspectral
Not every sensor works for every disease problem. The right pick depends on the signal you need to see: reflected light, canopy temperature, or a narrow spectral pattern. Once you know what kind of symptom signal matters most, you can choose the sensor that’s most likely to catch it well.
RGB, multispectral, thermal, and hyperspectral sensors compared
Each sensor type picks up a different kind of plant stress signal. Here’s where each one fits best.
| Sensor Type | Best Use | Strengths | Limitations | Relative Cost |
|---|---|---|---|---|
| RGB | Visual scouting, plant counts, basic mapping | Low cost, easy to read | Cannot detect invisible stress before symptoms appear | Low |
| Multispectral | Early stress detection, chlorophyll monitoring | Captures NIR and Red Edge; enables indices like NDVI/NDRE | Can saturate in dense canopies; requires calibration | Moderate |
| Thermal | Water stress, transpiration changes, early infection | Detects temperature changes before visual wilting | Highly sensitive to time of day and weather conditions | High |
| Hyperspectral | Specific disease identification, chemical signatures | Captures hundreds of narrow bands for precise fingerprinting | Extremely high data volume; complex processing | Very High |
Reflectance, canopy temperature, and vegetation indices
Drone sensors don’t diagnose disease on their own. They measure signals: shifts in how plants reflect light or give off heat. Those shifts can point you to a stressed area.
For example, NDVI compares near-infrared and red reflectance. It’s widely used, but there’s a catch: it can saturate in dense canopies. WDVI Green tends to saturate less often after canopy closure.
Thermal data adds a second signal. Canopy temperature, picked up by thermal sensors, can show stress before you see wilting. Why? Stressed plants often transpire less, and that makes the canopy run hotter.
Put reflectance and thermal data together, and you get a stronger field-checking setup. One signal can hint at trouble. Two signals give you a better reason to go inspect that zone on the ground.
With the right sensor in place, the next step is collecting images under stable flight conditions.
Plan the flight and collect usable field images
Good imagery starts before the drone leaves the ground. If lighting shifts, overlap is too thin, or the flight path is off, your results can fall apart in quiet ways. The map may look fine at a glance, but still miss early disease signals. Those setup choices shape whether your field maps are clean enough for disease analysis.
Map fields, set overlap, and fly in stable conditions
Start by mapping your field boundaries with care. Clear boundary mapping helps your flight path cover the whole area and makes repeat flights easier to line up over time. Use the same RTK georeferencing approach each time so flights land on the same field locations.
For image overlap, use enough front and side overlap to support accurate stitching and georeferencing. Fly in steady light, and stay away from windy conditions or shifting cloud cover.
Before takeoff, run the same calibration and logging steps every time.
Pre-flight checklist for calibration, image capture, and logging
Use the same pre-flight routine every time so your imagery stays comparable.
- Calibrate your sensor
Follow the same calibration procedure each time so your data stays comparable across flights. - Verify GPS and georeferencing
Confirm your RTK fix is active and stable before launch. Log the date in MM/DD/YYYY format, the time, and the GPS coordinates for the flight. Without accurate georeferencing, hotspot maps won’t match field locations. - Log field and environmental context
Record crop growth stage, recent rainfall, temperature, wind speed, and any known field issues - drainage problems, previous disease history, or areas of compaction. This context helps later when you’re reviewing results and trying to tell whether a stressed zone points to disease or something else.
Log GPS details, weather, boundaries, and field notes in HarvestYield.
Consistent logs make later hotspot comparisons more useful. Once the flight is logged, stitch the images and build hotspot maps.
Process images and find disease hotspots
After capture, turn the raw images into maps you can actually use in the field. On their own, raw files don't tell you much. They need to be stitched, cleaned up, and turned into hotspot maps that point you to spots worth checking.
Stitching, cleanup, and index generation
The first step is mapping software. It merges overlapping images into a single orthomosaic, which is a georeferenced map of the whole field. Then clean out blurred or incomplete frames and apply radiometric correction to deal with lighting changes during the flight. If you skip that step, a cloud shadow or a shift in sun angle can look like plant stress when it isn't.
Next, generate vegetation index layers from the corrected reflectance data. NDVI is usually the starting point. But there's a catch: in dense canopies, NDVI can lose sensitivity. When the canopy closes, it makes sense to switch to an index that doesn't saturate as easily. For dense canopies, WDVI Green is often the better option.
From there, use those layers to rank the zones that are most likely to need a ground check.
Using machine learning to classify stressed zones
Once the index layers are ready, machine learning models can scan the map for patterns tied to disease stress. They look at color data, reflectance, and temperature to sort disease stress from other issues like insect damage or drought stress. The result is a scouting map, not a diagnosis.
The model flags where to scout; ground verification decides action.
That ranked map then feeds straight into the ground verification step.
Confirm findings and turn maps into action
Use the map to guide a ground check before you make any treatment call.
Check hotspots on the ground before making treatment decisions
Treat the hotspot map like a field checklist.
Walk the marked zones and inspect plants up close. Check the leaves, stems, and soil surface. Then compare sick plants with nearby healthy rows. That side-by-side view often makes the issue easier to spot. Keep one question front and center: is this disease, or are you looking at drought stress, insect damage, or a soil problem?
Estimate severity and the number of affected acres. A hotspot from the air can look bigger than it is once you're standing in the field, and that can change what you do next. On the flip side, a small cluster that seems minor on the map can point to early spread and call for fast action. Take photos and tie them to GPS coordinates so you can return to the same spot on the next flight and compare what changed.
Once you confirm the cause, mark ONLY the affected zones for action.
Log follow-up work and track changes over time
After the ground check, schedule follow-up scouting and treatment tasks with GPS coordinates attached so your team can return to the exact spot. Start with hotspots showing the highest disease pressure or the earliest signs of spread.
Log each confirmed hotspot, the treatment used, and the revisit date so the next flight can show whether pressure is dropping. Use HarvestYield to store GPS-tagged scouting notes and compare follow-up imagery by field and date. When you come back later, you can see what was treated, where it happened, and the conditions at the time, then line that up with new imagery to check whether disease pressure has changed.
FAQs
Can drones detect disease before I can see symptoms?
Yes. Modern drones can detect crop stress tied to disease before you can see it with the naked eye.
They do this with multispectral, thermal, and hyperspectral imaging. Those tools pick up early signs of stress and help flag the parts of a field that may need attention, so treatment can be more targeted instead of broad and wasteful.
AI-powered analysis can then turn that imagery into alerts. And HarvestYield can log those findings with precise GPS coordinates, which makes tracking issues and managing the field a lot easier.
Which drone sensor is best for crop disease scouting?
For crop disease scouting, multispectral, thermal, or hyperspectral sensors are the top picks. They can spot stress in the field that you may not see just by walking the rows.
Pair those sensors with photogrammetry and RTK-corrected positioning, and you can map affected plants with much better accuracy. That makes it easier to target treatments where they’re needed instead of treating the whole field.
Why do I still need ground checks after a drone flight?
Ground checks still matter. Drones can’t inspect roots or soil on their own, and thick crop canopies can make images harder to read.
So the best way to use aerial imagery is as a guide. It helps you spot patterns like disease stress or drought stress across a field. Then, field checks confirm what’s actually going on.
HarvestYield can help schedule those visits and log ground observations.